This profile provides key demographic information on Latino eligible voters1 and other major groups of eligible voters in Georgia.2 All demographic data are based on Pew Research Center tabulations of the U.S. Census Bureau’s 2014 American Community Survey.3
Georgia Voter Registration Statistics
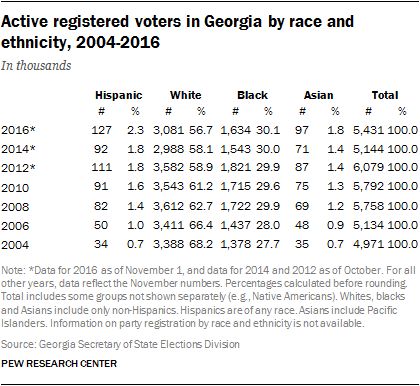
According to the Georgia Secretary of State Elections Division, voter registration statistics as of November 1, 2016 show that 127,000 Latinos are registered to vote statewide. Overall, Latinos make up only 2.3% of the state’s 5.4 million registered voters. The majority of voters in Georgia are white—there are 3.1 million white registered voters, representing 56.7% of all registered voters in Georgia. Additionally, 30.1% of registered voters in Georgia are black, with about 1.6 million voters statewide. Asians represent a slightly smaller share of registered voters than Hispanics, with 97,000 registered statewide (1.8% of all registered voters in Georgia).
The number of Latinos registered to vote has nearly tripled since 2004: It rose from 34,000 during the 2004 presidential election to 111,000 during the 2012 presidential election and now stands at 127,000. Their share of registered voters in Georgia has also risen since 2004, from just 0.7% in 2004 to 2.3% today. In 2004, whites made up more than two-thirds of all registered voters in Georgia (68.2%). That share has been dropping, and whites now make up fewer than six-in-ten of all registered voters in Georgia (56.7%).
Hispanics in Georgia’s Eligible Voter Population
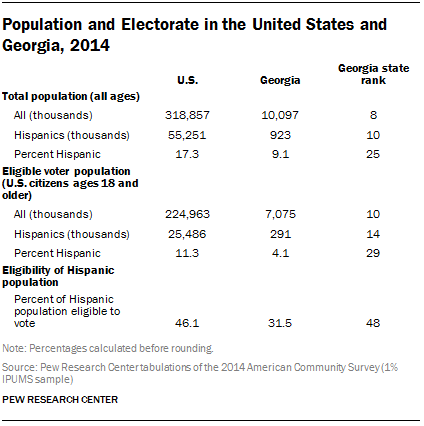
- The Hispanic population in Georgia is the 10th largest in the nation. About 923,000 Hispanics reside in Georgia, 1.7% of all Hispanics in the United States.
- Georgia’s population is 9% Hispanic, ranking 25th in Hispanic statewide population share nationally.
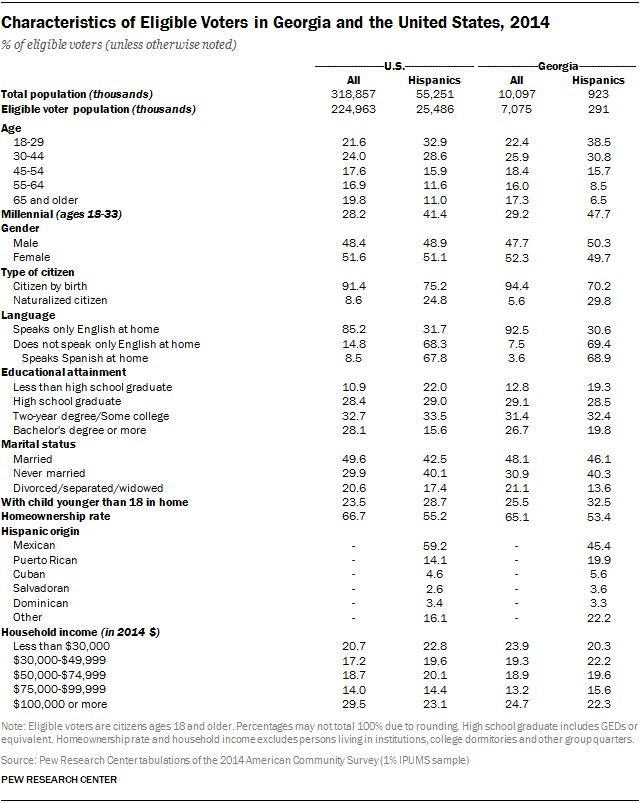
- There are 291,000 Hispanic eligible voters in Georgia—the 14th largest Hispanic statewide eligible voter population nationally. California ranks first with 6.9 million.
- Some 4% of Georgia eligible voters are Hispanic, ranking 29th in Hispanic statewide eligible voter share nationally. New Mexico ranks first with 40%.
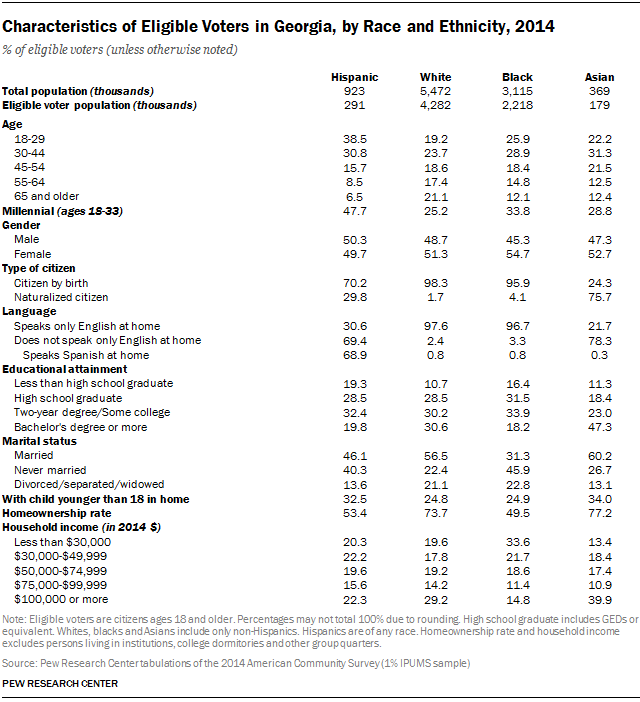
- About three-in-ten Hispanics in Georgia are eligible to vote (32%), ranking Georgia 48th nationwide in the share of the Hispanic population that is eligible to vote. By contrast, 78% of the state’s white population is eligible to vote.