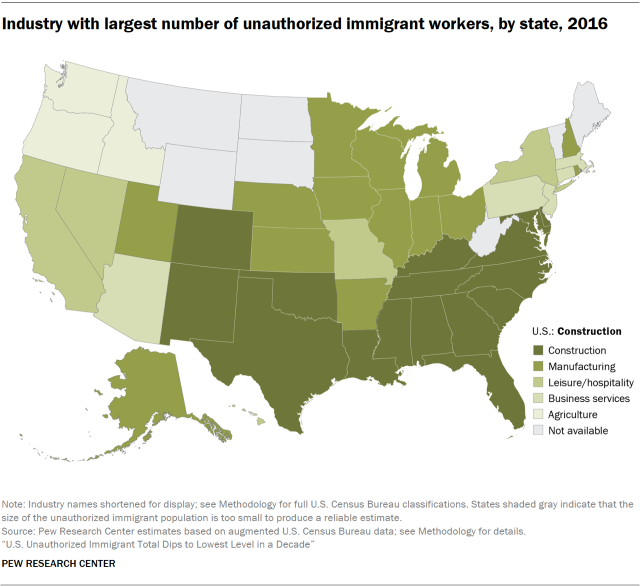
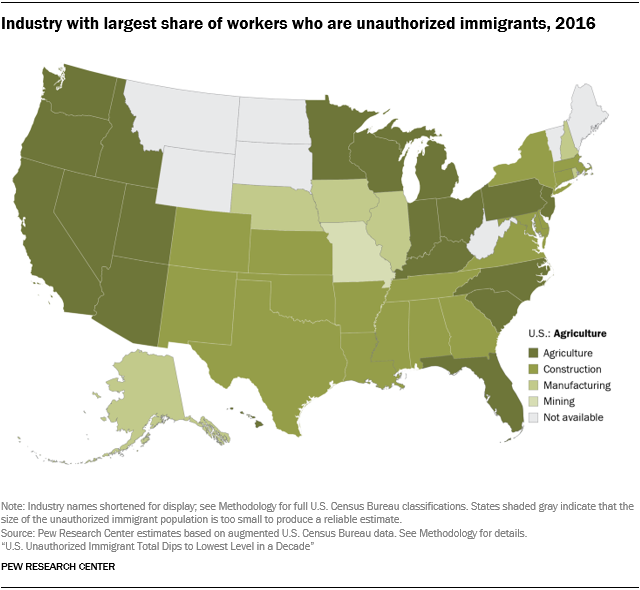
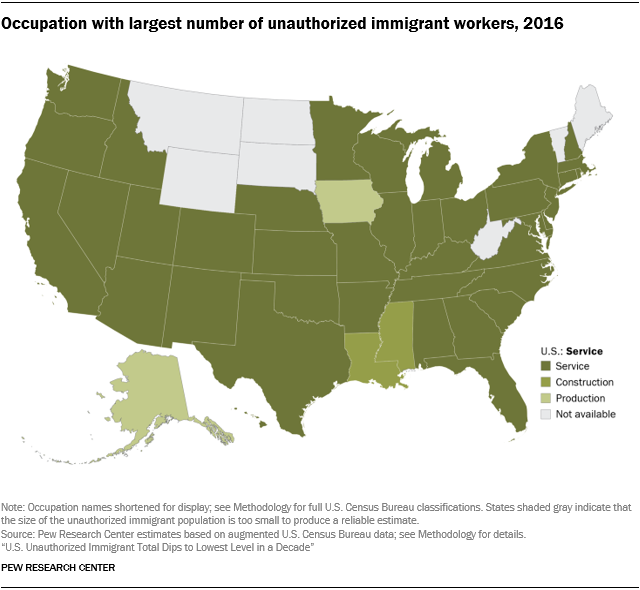
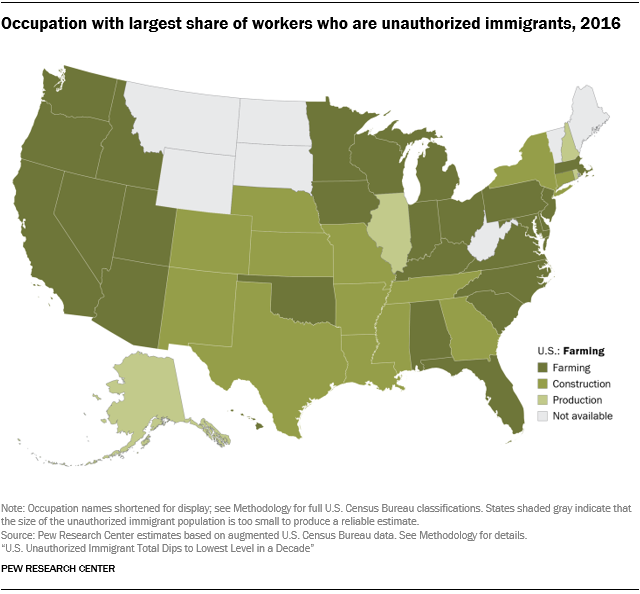
Numbers, Facts and Trends Shaping Your World

U.S. Unauthorized Immigrant Total Dips to Lowest Level in a Decade

Appendix B: Additional maps

U.S. map showing the total unauthorized immigrant population by state, 2016.
U.S. map showing the unauthorized immigrant share of the total population by state in 2016.
U.S. map showing the unauthorized immigrant share of all immigrants by state in 2016.
U.S. map showing the share of K-12 students with unauthorized immigrant parents by state in 2016.
U.S. map showing the Mexican share of the total unauthorized immigrant population by state in 2016.
U.S. map showing the change in the total unauthorized immigrant population by state from 2007 to 2016.
U.S. map showing the share of unauthorized immigrant adults that have been in the U.S. for five years or less in 2016.
U.S. map showing the unauthorized immigrant share of the labor force by state in 2016.
U.S. map showing the industry with the largest number of unauthorized immigrant workers by state in 2016.
U.S. map showing the industry with the largest share of workers who are unauthorized immigrants by state in 2016
U.S. map showing the occupation with the largest share of workers who are unauthorized immigrants by state in 2016.
U.S. map showing the occupation with the largest number of workers who are unauthorized immigrants by state in 2016.

Sign up for The Briefing

Weekly updates on the world of news & information