Estimates of the lawful permanent resident and foreign-born U.S. citizen population
The estimates presented in this report for the U.S. lawful immigrant population, including the number of foreign-born U.S. citizens and those eligible to apply for citizenship, are based on a residual estimation methodology developed to estimate the unauthorized immigrant population in the U.S.
The residual estimation methodology compares a demographic estimate of the number of immigrants residing legally in the country with the total number of immigrants as measured by a survey – either the American Community Survey or the March Supplement to the Current Population Survey. The difference is assumed to be the number of unauthorized immigrants in the survey, a number that later is adjusted for omissions from the survey (see below). The basic estimate is:

The lawful resident immigrant population is estimated by applying demographic methods to counts of lawful admissions covering the period since 1980 obtained from the Department of Homeland Security’s Office of Immigration Statistics and its predecessor at the Immigration and Naturalization Service, with projections to current years, when necessary. Initial estimates here are calculated separately for age-gender groups in six states (California, Florida, Illinois, New Jersey, New York and Texas) and the balance of the country; within these areas the estimates are further subdivided into immigrant populations from 35 countries or groups of countries by period of arrival in the United States. Variants of the residual method have been widely used and are generally accepted as the best current estimates (Baker and Rytina, 2013; Warren and Warren, 2013). See also Passel, Cohn and Gonzalez-Barrera (2013), Passel and Cohn (2008), Passel (2007) and Passel et al. (2004) for more details.
The overall estimates for unauthorized immigrants build on these residuals by adjusting for survey omissions for these six states and the balance of the country, subdivided for Mexican immigrants and other groups of immigrants (balance of Latin America, South and East Asia, rest of world) depending on sample size and state.
Once the residual estimates have been produced, individual foreign-born respondents in the survey are assigned a specific status (one option being unauthorized immigrant) based on the individual’s demographic, social, economic, geographic and family characteristics in numbers that agree with the initial residual estimates for the estimated lawful immigrant and unauthorized immigrant populations. These status assignments are the basis for the characteristics reported here (including, for example, specific countries of birth, detailed state estimates and period of arrival). A final step in the weighting-estimation process involves developing final state-level estimates that take into account trends over time in the estimates.
Comparability with previous estimates
The estimates presented here for 1995-2015 are internally consistent and comparable across years. The 2005-2015 estimates are based on the American Community Survey (ACS); those for 1995, 1998, 2000 and 2003, on the March Current Population Survey (CPS). The estimates presented in this report supersede all previous published Pew Research Center estimates, especially estimates for the same dates using different data. For 2005-2015, some previous estimates have been based on the CPS rather than the ACS; see for example a 2012 Pew Research Center report covering 1995-2011 using only CPS-based estimates and a 2015 publication with ACS-based estimates for 2005-2012 and preliminary estimates for 2013-2015 based on the CPS. ACS-based estimates are superior to CPS-based estimates for the reasons discussed below. Previous Center releases since September 2013 (Passel and Cohn, 2015; Passel et al., 2014; Passel, Cohn and Gonzalez-Barrera, 2013 and related graphics) include a mix of CPS-based and ACS-based estimates, but also show CPS-based estimates for additional years – 1996-1997, 1999, 2001-2002 and 2004. These earlier estimates are consistent with estimates published here.
The estimates in this report and previous Center publications since 2013 are based on survey data consistent with the censuses of 1990, 2000 and 2010. For the 1995-2009 surveys, special weights were developed to align with both the preceding and subsequent censuses (see below). As such, population figures for these years are not identical to those published from the original surveys.
Status assignments: Lawful and unauthorized immigrants
Individual survey respondents are assigned a status as a lawful or unauthorized immigrant based on the individual’s demographic, social, economic and geographic characteristics so that the resulting number of immigrants in various categories agrees with the totals from the residual estimates. The assignment procedure employs a variety of methods, assumptions and data sources.
First, all immigrants entering the U.S. before 1980 are assumed to be lawful immigrants. Then, the ACS and CPS data are corrected for known over-reporting of naturalized citizenship on the part of recently arrived immigrants (Passel et al., 1997). Specifically, immigrants in the U.S. less than six years are not eligible to naturalize unless they are married to a U.S. citizen, in which case they can naturalize after three years. Immigrants reporting as naturalized who fail to meet these requirements are moved into the noncitizen category. All remaining naturalized citizens from countries other than Mexico and those in Central America are assigned as lawful. Persons entering the U.S. as refugees are identified on the basis of country of birth and year of immigration to align with known admissions of refugees and asylees (persons granted asylum). Then, individuals holding certain kinds of temporary visas are identified in the survey and each is assigned a specific lawful temporary migration status using information on country of birth, date of entry, occupation, education and certain family characteristics. The specific visa types identified and supporting variables are:
Diplomats and embassy employees (A visa) Foreign students (F, M visa) Visiting scholars (J visa) Physicians (J visa) Registered nurses (H-1A visas) Intracompany transfers (L visas) “High-tech” guest workers (H-1B visas) International organizations (G visas) Religious workers (R visas) Exchange visitors (J visas) Athletes, artists and entertainers (O, P visas) Spouses and children within the various categories
Finally, immigrants are screened on the basis of occupations, participation in public programs and family relationships with the U.S. born and lawful immigrants. Some individuals are assigned as lawful immigrants on the basis of these characteristics:
Refugees and naturalized citizens Lawful temporary immigrants Persons working for the government or the Armed Forces Veterans or members of the Armed Forces Participants in government programs not open to unauthorized immigrants:
Supplemental Security Income (SSI), Temporary Assistance for Needy Families (TANF), Medicare, Medicaid and food stamps (Supplemental Nutrition Assistance Program or SNAP)
Persons entering the U.S. before 1980 Persons with certain occupations that require lawful status or government licensing (e.g. police officers and other law enforcement occupations, lawyers, health care professionals) Children of citizens and lawful temporary migrant Most immediate relatives of U.S. citizens, especially spouses Other family members, especially those entering the U.S before lawful residents
As result of these steps, the foreign-born population is divided between individuals with “definitely lawful” status (including long-term residents, naturalized citizens, refugees and asylees, lawful temporary migrants and some lawful permanent residents) and a group of “potentially unauthorized” migrants. (See Passel, 2007 and Passel et al., 2004 for additional detail.)
One change instituted for the new status assignments using the 2013- 2015 ACS was to assume that virtually all Cubans entering the U.S. are lawful residents, even if they are not assigned refugee status, because they are treated differently from other arrivals based on the Cuban Adjustment Act of 1966. Status assignments for other years did not take this into account and, as a result, assigned too many Cubans as unauthorized. To make adjustments for this omission, a weighting adjustment was made in the CPS-based estimates for 1995-2003 and ACS-based estimates for 2005-2012. In these adjustments, the weight previously assigned to unauthorized Cubans was reassigned to unauthorized immigrants from other parts of Latin America while keeping in place the overall total estimates for states.
The number of potentially unauthorized migrants typically exceeds the estimated number of unauthorized migrants (from the residual estimates) by 20-35% nationally. So, to have a result consistent with the residual estimate of lawful and unauthorized immigrants, probabilistic methods are employed to assign lawful or unauthorized status to these potentially unauthorized individuals. The base probability for each assignment is the ratio of the residual estimate to the number of potentially unauthorized immigrants. These initial probabilities are first adjusted separately for parents living with their children and all others (to ensure that an appropriate number of unauthorized children are selected) and then by broad occupation categories.
After this last step in the probabilistic assignment process, there is a check to ensure that the statuses of family members are consistent; for example, all family members entering the country at the same time are assumed to have the same status. The resulting populations for unauthorized immigrants are compared with the residual estimates; if they disagree, the assignment probabilities are adjusted and the random assignments are repeated. The entire process requires several iterations to produce estimates that agree with the demographically derived population totals. At the end, the final estimates agree with the residual estimates for the six individual states noted earlier and for the balance of the country; for lawful and unauthorized immigrants in each area born in Mexico, Latin America, Asia and the rest of the world (subject to sample size considerations); and for children, working-age men and working-age women within each category. Finally, the survey weights for the foreign-born are adjusted upward for survey omissions (undercount) so the tabulated figures agree with the adjusted analytic, demographic estimates of the total number of lawful immigrants and unauthorized migrants developed in the very first step.
Data sources and survey weights
The American Community Survey is an ongoing survey conducted by the U.S. Census Bureau. The survey collects detailed information on a broad range of topics, including country of birth, year of immigration and citizenship – the information required for the residual estimates. The ACS has a continuous collection design with monthly samples of about 250,000; the nominal annual sample size was about 2.9 million households for 2005-2009 with about 1.9 million included in the final sample. The initial sample was expanded to almost 3.3 million addresses for 2011 and over 3.5 million for 2012; the final sample for 2014 included more than 2.3 million addresses.
For this report, public-use samples of individual survey records from the ACS are tabulated to provide the data used in the estimation process. The public-use file is a representative 1% sample of the entire U.S. (including about 3 million individual records for each year 2005-2015) obtained from the Integrated Public-Use Microdata Series or IPUMS. The ACS began full-scale operation in 2005 covering only the household population; since 2006 it has covered the entire U.S. population. ACS data are released by the Census Bureau in September for the previous year.
The other survey data source used for residual estimates comes from March Supplements to the Current Population Survey. The CPS is a monthly survey currently of about 55,000 households conducted jointly by the U.S. Bureau of Labor Statistics and the Census Bureau. Since 2001, the March Supplement sample has been expanded to about 80,000 households; before then, the expanded March Supplement sample included about 50,000. The CPS universe covers the civilian noninstitutional population. The CPS was redesigned in 1994 and, for the first time, included the information required for the residual estimates (i.e., country of birth, date of immigration and citizenship). Some limitations of the initial March Supplement of redesigned CPS, 1994 – especially the limited coding of country of birth – preclude its use in making these estimates, so the first CPS-based estimates are for March 1995. CPS data are released by the Census Bureau in September for the previous March.
The population estimates for the surveys are based on the latest available figures at the time the survey weights are estimated. This process produces the best estimates available at the time of the survey, but it does not guarantee that a time series produced across multiple surveys is consistent or accurate. Significant discontinuities can be introduced when the Census Bureau changes its population estimation methods, as it did several times early in the 2000s and in 2007 and 2008 (Passel and Cohn, 2010), or when the entire estimates series is recalibrated to take into account the results of a new census.
The estimates shown for lawful immigrants and the underlying survey data are derived from ACS IPUMS 1% samples for 2005-2015 and March CPS public-use files for 1995, 1998, 2000 and 2003, which have been reweighted to take into account population estimates consistent with the 1990 census, the 2000 census, the 2010 census and the most recent population estimates. The population estimates used to reweight the ACS for 2005 through 2009 and the March 2003 CPS are the Census Bureau’s intercensal population estimates for the 2000s; these population estimates use demographic components of population change for 2000-2010 and are consistent with both the 2000 and 2010 censuses. Similarly, the population estimates used to reweight the CPS for March 1995, 1998 and 2000 are the intercensal population estimates for the 1990s (U.S. Census Bureau, 2013), which are consistent with the 1990 and 2000 censuses. The ACS data for 2010-2015 do not require reweighting as they are weighted to recent population estimates based on the 2010 census. The original 2005 ACS covered the household population, but not the population living in group quarters (about 8 million people). For Pew Research Center analyses, we augmented the 2005 ACS with group quarters records from the 2006 ACS but weighted to agree with the 2005 population estimates. The reweighting methodology for both the ACS and CPS follows, to the extent possible, the methods used by the Census Bureau in producing the sample weights that equal the population totals. See Passel, Cohn and Gonzalez-Barrera, 2013 for more details on weighting and adjustments for survey undercoverage.
Because of the much, much larger sample size in the ACS (3.1 million sample cases in 201 including more than 360,000 foreign-born cases) than the March CPS (200,000 sample cases in 2015 with about 26,000 foreign-born), the ACS-based estimates should be considered more accurate than the CPS-based estimates. In this publication, we have replaced the previously published CPS-based estimates for years from 2005 onward with the new ACS-based estimates.
Other methodological issues
Adjustment for undercount
Adjustments for omissions from the surveys (also referred to as adjustments for undercount) are introduced into the estimation process at several points. The initial comparisons with the survey (based on the equation shown above) take the difference between the immigrants in the survey and the estimated lawful immigrant population. Since the comparison is people appearing in the survey, the estimated lawful immigrant population must be discounted slightly because some lawful immigrants are missed by the survey. This initial estimate represents unauthorized immigrants included in the survey. To estimate the total number of unauthorized immigrants in the country, it must be adjusted for those left out. Similarly, the estimated number of lawful immigrants appearing in the survey must also be adjusted for undercount to arrive at the total foreign-born population.
These various coverage adjustments are done separately for groups based on age, sex, country of birth and year of arrival. The patterns and levels of adjustments are based on Census Bureau studies of overall census coverage (see U.S. Census Bureau, 2012 for links to evaluation studies of the 1980, 1990, 2000 and 2010 censuses; also Passel, 2001) that are adjusted up or down to reflect the results of a number of specialized studies that focus on immigrants. Census Bureau undercount estimates have generally been subdivided by race/Hispanic origin, age, and sex. So the adjustments to the Pew Research Center data use rates for countries of birth based on the predominant race of immigrants from the country – Hispanic and non-Hispanic races for white, black and Asian. Undercount rates for children do not differ by gender, but for younger adults (ages 18-29 and 30-49) the undercount rates for males tend to be higher, and for some groups much higher, than those for females. At older ages, the undercount rates are lower than for younger adults with no strong patterns of gender differences (and with some estimated overcounts).
The basic information on specific coverage patterns of immigrants is drawn principally from comparisons with Mexican data, U.S. mortality data and specialized surveys conducted at the time of the 2000 census (Van Hook et al., 2014; Bean et al., 1998; Capps et al., 2002; Marcelli and Ong, 2002). In these studies, unauthorized immigrants generally have significantly higher undercount rates than lawful immigrants who, in turn, tend to have higher undercounts than the U.S.-born population. More recent immigrants are more likely than longer-term residents to be missed. The most recent study (Van Hook et al., 2014) finds marked improvements in coverage of Mexicans in the ACS and CPS between the late 1990s and the 2000s. This and earlier work suggest very serious coverage problems with immigrants in the data collected before the 2000 census but fewer issues in the 2000 census and subsequent datasets. This whole pattern of assumptions leads to adjustments of 10% to 20% for the estimates of unauthorized immigrants in the 1995-2000 CPS, with slightly larger adjustments for unauthorized Mexicans in those years. (Note that this means even larger coverage adjustments, sometimes exceeding 30% for adult men younger than age 40.)
After 2000, the coverage adjustments build in steady improvements in overall coverage and improvements specifically for Mexican immigrants. The improvements are even greater than noted in the research comparing Mexico and U.S. sources because the reweighted ACS and CPS data imply even greater improvements in reducing undercounts, since they incorporate results of the 2010 census. With all of these factors, coverage adjustments increase the estimate of the unauthorized immigrant population by 8% to 13% for 2000-2009 and by 5% to 7% for 2010-2014. For the overall immigrant population, coverage adjustments hovered slightly below 5% during the 1990s and trended downward to around 2% to 3% by 2014. Since the population estimates used in weighting the ACS and the CPS come from the same sources, the coverage adjustments tend to be similar.
Countries and regions of birth
Some modifications in the original CPS countries of birth were introduced to ensure that all foreign-born respondents could be assigned to a specific country or region of birth. See Passel and Cohn (2008) for a detailed treatment of how persons with unknown country of birth were assigned to specific countries.
Defining regions of the world and, in some cases, specific countries using the various data sources requires grouping areas into identifiable units and “drawing lines” on the world map. In the historical data used to construct the lawful foreign-born population, it is not possible to differentiate the individual republics within the former Soviet Union. In both the CPS and ACS microdata, not all the individual republics can be identified; some are identified in some years but not others. However, a code is assigned for USSR in all years, even when the USSR no longer existed. Thus, for analytic purposes in this report, the former republics are grouped together and considered to be part of Europe, except for former USSR Central Asian republics, which are considered to be part of Asia.
For this report, Asia includes Afghanistan, Pakistan and countries to their east, as well as Oceania. The Middle East includes Bahrain, Egypt, Iran, Iraq, Israel, Jordan, Kuwait, Lebanon, Oman, the Palestinian territories, Qatar, Saudi Arabia, Syria, Turkey, United Arab Emirates and Yemen. Cyprus is considered part of Europe. Africa includes both Sub-Saharan Africa and North Africa (except for Egypt). The rest of the countries in North America and from a residual “other” category shown in ACS data are combined into an “other” category for the analysis in this report. The countries in Asia, Europe and the “other” category are included in the overall national estimates but are not shown separately in any tables or figures.
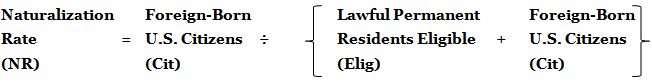
Naturalization rate
To estimate the naturalization rate of lawful immigrants, we divide the estimated number of foreign-born U.S. citizens in a given year by the estimated total number of immigrants who could have become U.S. citizens in that year, and are either U.S. citizens already or continue to be lawful permanent residents.
Eligibility to naturalize is assigned following two main requirements:
- Age: lawful permanent residents who are 18 years of age or older
- Length of stay: lawful permanent residents who have been in the U.S. for five years or longer (estimated using the year of arrival variable in ACS and CPS) or lawful permanent residents who are married to a U.S. citizen and have been in the U.S. for three years or longer.
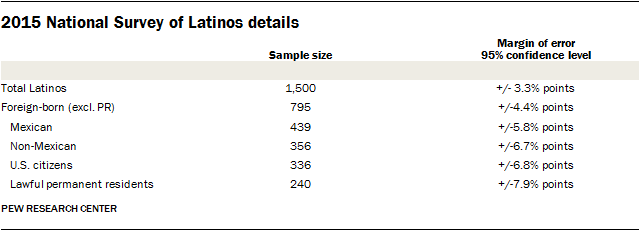
2015 National Survey of Latinos
Results for this study are based on telephone interviews conducted by SSRS, an independent research company, for the Pew Research Center among a nationally representative sample of 1,500 Latino respondents ages 18 and older. It was conducted on cellular and landline telephones from October 21 through November 30, 2015.
For the full sample, a total of 705 respondents were U.S. born (including Puerto Rico), and 795 were foreign born (excluding Puerto Rico). For results based on the total sample, one can say with 95% confidence that the error attributable to sampling is plus or minus 3.3 percentage points.
For this survey, SSRS used a staff of bilingual English- and Spanish-speaking interviewers who, when contacting a household, were able to offer respondents the option of completing the survey in Spanish or English. A total of 679 respondents (45%) were surveyed in Spanish, and 821 respondents (55%) were interviewed in English. Any person ages 18 or older who said they were of Latino origin or descent was eligible to complete the survey.
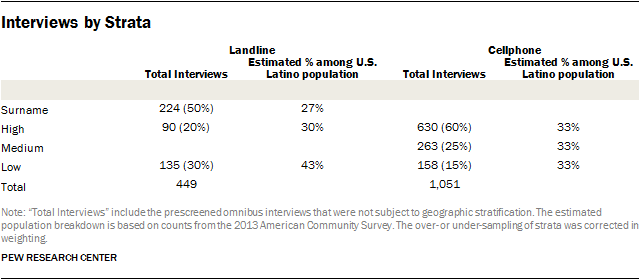
To ensure the highest possible coverage of the eligible population, the study employed a dual-frame landline/cellular telephone design. The sample consisted of a landline sampling frame (yielding 449 completed interviews) and a cell phone sampling frame (1,051 interviews).11 Both the landline and cell phone sampling frames used a stratified sampling design, oversampling areas with higher densities of Latino residents. Overall the study employed six strata. Landline and cellphone samples were provided by Marketing Systems Group (MSG).
For the landline sampling frame, the sample was compared with InfoUSA and Experian landline household databases, and phone numbers associated with households that included persons with known Latino surnames were subdivided into a surname stratum. The remaining, unmatched and unlisted landline sample was used to generate a stratum with a high incidence of Latinos, based upon the share of Latinos in the sample telephone exchange.
It is important to note that the existence of a surname stratum does not mean the survey was exclusively a surname sample design. The sample is RDD (random-digit-dial), with the randomly selected telephone numbers divided by whether or not they were found to be associated with a Spanish surname. This was done to ease administration by allowing for more effective assignment of interviewers and labor hours, as well as increase the efficiency of the sample.
MSG’s GENESYS sample generation system was used to generate cell phone sample, which was divided into High and Medium strata, based upon the share of Latinos in the sample telephone area code.
Samples for the low-incidence landline and low-incidence cell strata were drawn from previously interviewed respondents in SSRS’s weekly dual-frame Excel omnibus survey. Respondents who indicated they were Latino on the omnibus survey were eligible to be re-contacted for the present survey. Altogether, a total of 293 previously-interviewed respondents were included in this sample.
A multi-stage weighting procedure was used to ensure an accurate representation of the national Hispanic population.
- An adjustment was made for all persons found to possess both a landline and a cell phone, as they were more likely to be sampled than were respondents who possessed only one phone type. This adjustment also took into account the different sampling rate in the landline and cellphone samples.
- The sample was corrected for a potential bias associated with re-contacting previously interviewed respondents in low-incidence strata.
- The sample was corrected for within-household selection in landline interviews, which depended upon the number of Latino adults living in the household.
- The sample was corrected for the oversampling of telephone number exchanges known to have higher densities of Latinos and the corresponding undersampling of exchanges known to have lower densities of Latinos.
- Finally, the data were put through a post-stratification sample balancing routine. The post-stratification weighting utilized estimates of the U.S. adult Hispanic population based on the 2013 U.S. Census Bureau’s American Community Survey, on gender, age, education, Census region, heritage and years in the U.S.. Phone status of the U.S. adult Hispanic population (i.e., cell phone only, dual/landline only) is based on estimates from the January-June 2015 Centers for Disease Control’s National Health Interview Survey and density of the Latino population is from the 2010 Census.
- Weights are then trimmed to avoid any particular case having too much influence on the overall estimates.


