Population Estimates and Projections: Definitions, Methods and Data Sources
Overall Methodology
The national projections presented here use a variant of the basic cohort component model in which the initial population is carried forward into the future by adding new births, subtracting deaths, adding people moving into the country (immigrants), and subtracting people moving out (emigrants). The model used for Pew Research Center projections and historical population estimates was presented in a previous report (Passel and Cohn, 2008); it is the cohort component method modified to incorporate immigrant generations by Edmonston and Passel (1992). In this application, five generation groups for U.S. residents are defined and then collapsed to the three conventional generation groups:
- Foreign-born population, or the first generation;
- U.S.-born population of foreign (or mixed) parentage, or the second generation;
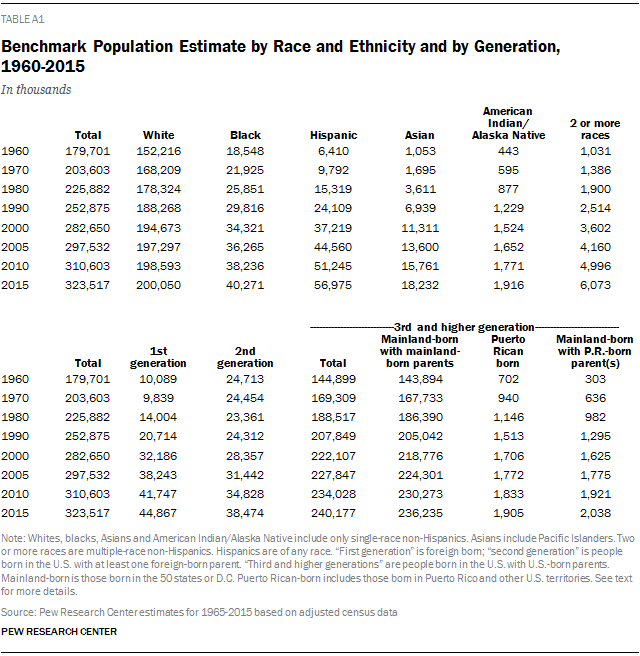
- U.S.-born population with U.S.-born parents, or third-and-higher generation: 3a. Puerto Rican-born population (includes all people born in U.S. territories); 3b. Mainland-born population (i.e., people born in the 50 states plus the District of Columbia) with at least one Puerto Rican-born parent; and 3c. Mainland-born population with mainland-born parents plus people born in foreign countries to U.S. citizen parents (i.e., the population born abroad of American parents).
In the projection methodology, each of the five generation groups is carried forward separately. Immigrants and emigrants enter and leave the first generation; migrants from Puerto Rico and other U.S. territories enter (and leave) the Puerto Rican-born population. Births are assigned to generations based on the generation of the mother and a matrix allowing for cross-generational fertility. All births to first-generation women are assigned to the second generation; all births to the Puerto Rican-born population are assigned to the Puerto Rican parentage population (group 3.b). Most births to the second and third-and-higher generations are assigned to the third-and-higher generation, but some are assigned to the second generation to allow for mixed generation couples that include immigrants. Likewise, most births to women of Puerto Rican parentage are assigned to the third-and-higher generation, but some are assigned to the Puerto Rican parentage population to allow for mixed couples including Puerto Rican-born migrants. The generational assignment matrix (or G matrix) is based on race/ethnic origin but is allowed to vary dynamically in the 2015-2065 projections based on relative generational sizes.
For these projections, the entire population is divided into six mutually exclusive racial/ethnic groups:
- Hispanic origin;
- White alone, not Hispanic;
- Black alone, not Hispanic;
- Asian or Pacific Islander alone, not Hispanic (generally called “Asian”);
- American Indian/Alaska Native (AIAN) alone, not Hispanic; and
- Two-or-more races, not Hispanic
The report also includes a historical analysis using data developed with the same projection methods and estimates of the demographic components. The components are estimated so as to reproduce as closely as possible a series of benchmarks—the decennial censuses from 1960 to 2000 and estimated populations for 2005, 2010 and 2015 by age, sex, race/Hispanic origin and generation with adjustments for census undercount. The projections and historical analyses use five-year age groups up to 85 years and older by sex. The projections are done for five-year time steps from July 1, 2015 to July 1, 2065; the historical estimates also include five-year time steps from 1960 to 2015.
The remainder of this section describes the underlying data and assumptions for the projections and historical analyses. The first section describes the benchmark populations and the methods for defining and measuring the racial/ethnic groupings and the generational groups. The next sections treat the assumptions for the major demographic components of immigration, fertility and mortality for 2015-2065, with a particular emphasis on immigration. Within each of these components, the data and the methods used to define the historical population and components of change are described.
Demographic Components of Population Change
Demographic components of population change account for all additions and subtractions from the national U.S. population. Births and deaths are the largest of the components, but measurement of immigration is far more complicated because there are multiple channels of entry to and exit from the U.S. population. For some of parts of the immigration component, such as legal immigration, the available data are better and accurate measurement is easier than for others, such as unauthorized (sometimes called “illegal”) immigration. The measurement methods differ among the immigration components, in part, because of the nature of the data and, in part, because some of the immigration concepts dictate particular methods.
The demographic components included in the population projection model are:
Births (or fertility rates); Deaths (or mortality rates); Immigration— Total Immigration (including legal immigrants, refugees, asylees and unauthorized immigrants—but not broken out separately); Emigration; Net Movement from Puerto Rico and other U.S. Territories; Net Temporary Migration; Other Minor Components
Definitions (Race, Hispanic Origin and Generations)
Racial/Ethnic Groups
The race/Hispanic population groups used for the projections and in constructing the benchmark populations are mutually exclusive and encompass the entire U.S. population. They are almost identical to groups used by the Census Bureau in their current population estimates (U.S. Census Bureau, 2015), intercensal population estimates for 2000-2010 (U.S. Census Bureau, 2013) and recent population projections (U.S. Census Bureau, 2014). For the historical estimates and projections, the Asian (not Hispanic) and Native Hawaiian and other Pacific Islander or NHPI (not Hispanic) populations are combined in order to be consistent with pre-2000 data and because of the small size of the NHPI population.
In constructing the benchmark populations by age, sex, race-Hispanic origin and generation, we used microdata from the Integrated Public-Use Microdata Series (IPUMS) for decennial censuses of 1960-2000 and the American Community Survey (ACS) for 2001-2013. The race and Hispanic data collected in the decennial censuses and ACS do not correspond exactly to the definitions used in the Census Bureau’s population estimates and projections, nor do they match to the definitions used here. Consequently, a number of modifications had to be made in setting up the benchmark populations. The Hispanic origin variable is available in the 1980 Census and later and was used to construct the Hispanic population estimates. For 1960 and 1970, IPUMS created a Hispanic origin variable roughly comparable to the post-1980 data using information on place of birth, mother tongue, surnames and family relationships. This IPUMS variable was used for the benchmark data on the Hispanic population.
In the 2000 Census and the 2001-2013 ACS, respondents are permitted to select more than one race. Most individuals who do so are classified as “two or more races,” with a few exceptions. First, if the two races are Asian and NHPI, the individuals are classified in our population estimates as “Asian.” Next, among non-Hispanics, some individuals are classified as “some other race,” a category not used in the Census Bureau’s the Census Bureau’s population estimates. Individuals who choose two races, one of which is “some other race” and the other is one of the five specified races (white, black, Asian, NHPI, AIAN), are classified in the specified race. The few non-Hispanic individuals who chose “some other race” are grouped with the white, not Hispanic population; for the 1960-1990 Censuses, the very few non-Hispanics of “some other race” were grouped with the white, non-Hispanic population.
Multiple Race, 1960-1990. These race assignment procedures do not yield completely consistent data across the 1960-2013. In particular, the data for 1960-1990 do not include a classification for non-Hispanics of mixed race of “two or more races.” To provide consistent data, we constructed estimates of people in 1960-1990 who would be in that group in 2000 and later. To start these estimates, we mapped the two-or-more-races population in the 2000 Census and the 2005-2013 ACS into single races using the IPUMS variable RACESINGD, which provides the most probable single race for individuals who chose more than one race group, on a case-by-case basis. By combining the remapped multiple race populations with the single race populations, we constructed a population for 2000 that is consistent with data as collected in the 1960-1990 Censuses. From these data, we construct estimates of the share of each age-sex-race/Hispanic origin group that provided multiple race responses in the 2000 Census (and in ACS data for 2001-2013). These percentages were estimated separately for the native population and for the foreign-born population subdivided by five-year periods of entry.
The percentages of the historically consistent U.S.-born race populations that identified as two-or-more races were then applied to the same U.S.-born cohorts in 1960 through 1990 to estimate the population of native population by single race and of two or more races. For the foreign-born population, similar percentages were calculated for age-sex groups in pre-1990 entry cohorts; these shares were then applied to the same age-sex-period-of-entry cohorts in earlier censuses. The same calculation was done for the “Puerto Rican-born” population. The result of these various estimation procedures is a set of population figures for 1960, 1970, 1980 and 1990 subdivided by age, sex, race/Hispanic origin (according to post-2000 definitions) for the foreign-born population, the population born in Puerto Rico and outlying areas, and the remaining U.S.-born population. For 2000-2013, the same groups are available from tabulations of IPUMS data.
Projected Race-Hispanic Origin. Both the historical population estimates for 1960-2015 and projections for 2015-2065 use race/Hispanic origin categories consistent with current data from the ACS. For the projections, births are assigned to the race/Hispanic origin category of the mother. The definitions, usage, practices and race/ethnic identities in the future might be quite different. In particular, marriage across race/Hispanic origin categories has been increasing (Wang 2015) and future generations may choose to identify differently. Consequently, the projections presented here should be treated as the representing the continuation of the current race/Hispanic origin categories.
The methodology used for the projections includes parameters for assigning births to race/Hispanic origin categories other than the category of the mother. These parameters permit modeling of race/Hispanic intermarriage, childbearing with parents of different groups and changing patterns of self-identification. A particular example of the potential of such modeling is the projected population of two or more races. In the projections presented here, births in the two-or-more-races category come only from mothers in this population. It is likely, however, that future births in this group will also come from mothers (and fathers) in the specific race/Hispanic origin categories. Future projections will incorporate alternative assignments of births to groups other than mothers’.
Generations
The full array of generations can only be obtained directly from the 1960 and 1970 Censuses because these two include the questions on nativity, citizenship and parents’ places of birth that are required to produce tabulations of these five generations. In censuses since 1970 and the ACS, the parental birthplace questions were dropped, so the censuses of 1980, 1990 and 2000 and the 2001-2013 ACS can provide direct data only for the foreign-born, Puerto Rican-born, and U.S.-born populations; this U.S.-born population encompasses the second generation—generation (2), the mainland-born population of Puerto Rican parentage—generation (3.b), and the mainland-born population with mainland-born parents—generation (3.c). For the benchmark populations of 1980, 1990, 2000, 2005, 2010 and 2015, two different approaches were used to estimate the shares of the third-and-higher generation population in each of the three constituent groups. One approach is “forward looking,” i.e. based on 1960 and 1970 populations carried forward to the benchmark dates and the other “backward looking,” i.e., based on post-2000 data from the Current Population Survey (CPS).
In the forward-looking approach, the U.S.-born population by generation in 1960 or 1970 was projected forward (using the basic projections methodology) to the benchmark dates for 1980 and later. The U.S.-born population within each age-sex-race/Hispanic origin group (that was alive in 1960 or 1970) at each benchmark date was distributed to the more detailed generations using these projections. The initial approximations are based on the average of the 1960-based and 1970-based projections.
Beginning in 1994, the CPS includes the data needed to construct the fully-detailed five generations—country of birth, citizenship and country of birth of parents(s). Then, in 2003, the CPS race question allowed respondents to choose more than one race response, mirroring the 2000 Census, the existing ACS data for 2001-2002 and the yet-to-be-conducted ACS for 2003-2013. The CPS sample is too small to provide very precise estimates of generational distributions for some of the smaller groups. Accordingly, multiple monthly CPS and March supplements were averaged over 2003-2007 to estimate distributions for 2005, over 2008-2012 for 2010 and over 2010-2015 for 2015. Within age-sex-race/Hispanic origin cohorts, we estimated the share of the U.S.-born population in each of the constituent generations. These shares were applied to the same cohorts based on their ages in 1980, 1990, 2000, 2005, and 2010 to provide alternative estimates of the generational distributions. Next, the CPS-based backward-looking estimates were averaged with the 1960-1970-based forward looking estimates. A final adjustment involved checking the benchmark estimates for consistency with the census data.
Benchmark Population Estimates: 1960-2015
The basic population distributions (by age, sex, race/Hispanic origin and generation) for the benchmark dates through 2010 are based on the census and ACS figures developed with the procedures outlined above. Several further steps are required to produce an internally consistent set of population figures across time. Because of differential undercounts by age and across censuses, data for age-sex-race/Hispanic groups are generally not consistent over time. For example, black males at ages 10-14 and 15-19 have generally had lower undercount rates than the age groups 10 years older, 20-24 and 25-29 (Robinson, 2001); often the differences for the cohorts from one census to the next can be as much as 10 percentage points. This difference means that projection of these teenage cohorts to the next census date based on components of change, even when measured with extreme accuracy, will be 10 percentage points high when compared with the results of the subsequent census for the cohorts who are now in their 20s.
To reduce inconsistencies due to differential patterns of undercount across censuses, the benchmark populations and historical estimates are adjusted for census undercount using estimates based on those produced by the Census Bureau (Robinson, 2001 for data from the 1960-2000 Censuses and from Mule, 2012 for the 2010 census-based data used for 2005-2015). Overall, undercount rates are lowest for the white and Asian populations; higher for males than females; higher for young children and for adults aged 25-49. Pew Research Center analysis of data for the foreign-born population and of estimates measuring unauthorized immigration has found that undercount rates for the first generation are significantly higher than for the U.S.-born population (see Passel and Cohn 2014).
Adjustments for census undercount were 3.1% for the 1960 Census, 2.7% for 1970, 1.0% for 1980, 1.9% for 1990 and only 0.1% for 2000. The differential undercounts for the foreign-born population are driven largely, but not entirely, by the relatively poor coverage of unauthorized immigrants. Accordingly, differences between undercount rates for the U.S.-born and foreign-born populations are larger in more recent years when the number of unauthorized immigrants in the country is larger. Thus, adjustments for undercount of the immigrant population in 1960 and 1970, when there were few (or no) unauthorized immigrants in the country differ by less than 1 percentage point from the overall adjustment. However, in 1980 and later, the undercount rates for the foreign-born are significantly larger than the overall adjustments—2.6% in 1980, 5.5% in 1990 and 3.2% in 2000.
Population Estimates for 2005-2015
Initial population estimates for 2005 and 2010 were based on tabulations of ACS data from IPUMS. For 2005, however, the data were augmented with records for the group quarters population and the weights were adjusted to be compatible with the Census Bureau’s intercensal population estimates that take into account results of both the 2000 and 2010 Censuses. (See Passel and Cohn 2014 and Passel, Cohn and Gonzalez-Barrera 2013 for a description of these alternative weights and their impact in the population estimates.) Assignments from the three generations available in ACS data (foreign born, Puerto Rican born and U.S. born) to the full five-generation array used in our estimates and projections is based on projections from 2000 and earlier plus CPS data for surrounding years. Undercount adjustments for 2005 and 2010 used the detailed rates from 2000 with minor calibrations for 2010 results (Mule 2012).
For 2015, alternative population estimates were needed because the most recent ACS data for age-sex-race/Hispanic origin-generation groups was from the 2013 ACS or 2014 CPS. The data for 2015 by age-sex-race/Hispanic origin come from the Census Bureau’s Vintage 2014 population estimates (U.S. Census Bureau, 2015) for basic data and for monthly data through June 2015. First, we generated estimates for July 1, 2015 by extrapolating forward one month from the June 1, 2015 estimates. Next, the population in each age-sex-race/Hispanic group is distributed to foreign-born, Puerto Rican-born and U.S.-born generations based on distributions by cohort from the 2010-2013 ACS extrapolated to 2015. Then, the distribution was adjusted to the full five generations using projections from 2000 and earlier plus the most recent CPS data available. Finally, undercount rate adjustments for 2015 used the same rates as in 2010. As a check on the estimates for 2005, 2010 and 2015, projections from 2000 were used to identify misalignments and make final adjustments.
Immigration
The immigration assumptions are critical for both the projections and the historical analyses. Immigration increased substantially over the 1960-2005 period with particularly large increases for Hispanics and Asians. The rapid growth in the Hispanic population, for example, enabling Hispanics to surpass blacks as the largest minority population shortly after 2000 is attributable principally to the very large numbers of Hispanic immigrants arriving since 1965.
Immigration has been the most difficult demographic component to forecast. It is directly affected by national policies in ways that fertility and mortality are not. In addition, some immigration flows, especially of unauthorized immigrants can be very sensitive to economic conditions in the U.S. and abroad as flows can increase in economic boom times and drop when the economy is slow. Although many of the social and economic factors affecting migration trends are reasonably well-known, there is no broadly accepted theoretical framework that can be readily applied in a projections perspective (Howe and Jackson, 2005). (See Passel and Cohn, 2008 for a discussion of frameworks for projection and longer-term historical analyses.)
Historical Immigration, 1960-2015
Total immigration to the United States moved in a steadily upward direction from the 1930s through 1995-2000. From 1960-1965 to 1995-2000, the average annual flow of new immigrants increased more than fivefold (from about 330,000 per year to 1,770,000). Much of this increase was due to very significant growth in Hispanic immigration, with much of it from Mexico and much of it unauthorized. After 2000, the increase stopped and flows dropped very slightly for 2000-2005 (to an average of about 1,660,000). With the onset of the Great Recession of 2007-2009, immigration dropped dramatically after 2007, largely due to a decrease and then a reversal of unauthorized immigration from Mexico (Passel, Cohn and Gonzalez-Barrera 2012 and subsequent Pew Research Center reports on unauthorized immigration). For the 2005-2010, immigration flows (1,310,000 per year) were about 20% below those of the previous five years. Immigration remained slightly below this level after 2010 as unauthorized immigration flows fell to essentially zero (Passel and Cohn, 2015).
Separation of total immigration flows into legal and unauthorized is difficult. Although we have measures of the size of the unauthorized population at various points, the flows can be difficult to measure, especially for the period before 1995. Moreover, projection of legal and unauthorized immigration separately requires an assessment of future legislation affecting the legal status of the current and future immigrant populations. Accordingly, both the historical analyses and projections deal with the total immigration flow of both legal and unauthorized immigrants combined without attempting to differentiate them by legal status.
Initial estimates of immigrant arrivals for each five-year period from 1960-1965 through 2010-2015 were generated by tabulating data from the 1970-2000 censuses and 2001-2013 ACS. Generally, the “closest” census to the time interval was used to estimate immigrant arrivals by age, sex, race and Hispanic origin. The 1970 Census provided data for 1960-1964 and 1965-1969 based on a 3% merged sample from IPUMS; the 5% IPUMS data from the 1980 Census was used for 1970-1974 and 1975-1980; the 5% IPUMS data from the 1990 Census was used for the two five-year intervals in the 1980s; and the 5% IPUMS data from the 2000 Census provided the detailed data for 1990-1994 and 1995-1999. Note that only the 2000 Census includes the multiple race category needed for the historical analysis and projections. Detailed tabulations by race from the 2000 Census for pre-1990 periods of arrival were used to modify the estimates of arrivals for the two or more races group for 1960-1964 through 1985-1990 to conform to the post-2000 race categories using the same procedures described above for the benchmark populations.
ACS data provide information on annual arrivals by race for 2000-2013 with multiple observations on most years. For example each of the 13 years of ACS data has an estimate of immigrants arriving in 2000 whereas only the 2012 and 2013 ACS have information on 2012 arrivals (and. even then, the 2012 ACS covers only part of the year). For the initial estimates of immigrant arrivals covering 2000-2004, 2005-2009 and 2010-2012, we selected the data year with the largest number of arrivals in the race/Hispanic group. Generally, this was the data year with the first full-year accounting of the arrivals; for example, an estimate of arrivals for the full calendar year of 2006 is first available from the 2007 ACS. For calendar year 2013, we estimated full-year arrivals from the partial-year data of the 2013 ACS using average inflation factors for the previous three years (e.g. the ratio of full-year arrivals in 2012 from the 2013 ACS to partial-year arrivals for 2012 observed in the 2012 ACS). For 2014 arrivals, we used the average across 2011-2013.
The final estimates for immigrant arrivals for each of the five-year periods through 2010-2015 were developed from the basic population projection model and the population benchmarks for 1960-2015. The first step involved estimating the foreign-born population for 1970 from the benchmark 1960 population and initial estimates of immigrant arrivals for 1960-1965 and 1965-1970 (approximated by the 1960-64 and 1965-70 arrivals just described), together with estimates of mortality and emigration (see below). This initial estimate of the foreign-born population in 1970 fell short of the 1970 benchmarks for each of the race/Hispanic origin foreign-born groups. The estimates of immigrant arrivals were then adjusted upward for each group by the amount necessary to hit the 1970 benchmarks. This process was repeated using the revised estimate of the 1970 foreign-born population as a base for estimating the 1980 foreign-born population. Comparison of this initial 1980 foreign-born estimate yields adjustment factors for the 1970-1975 and 1975-1980 arrivals of each race/Hispanic origin group. This iterative estimation-adjustment process was repeated for 1980-1990, 1990-2000, 2000-2005, 2005-2010 and 2010-2015. The resulting estimates of total immigrant arrivals for each period (expressed as average annual values) are shown in Figure A1.
These data on five-year arrivals for 1965-1970 through 2010-2015 (plus temporary migrants as described below) are the basis for the estimate of 58.5 million arrivals during 1965-2015 shown in Table 1 of this report. Information by country and region of birth for the entire period was generated from the arrivals in each five-year period classified by country or region of birth and race/Hispanic origin. These detailed tabulations were adjusted to the race/Hispanic origin totals estimated from the iterative fitting process just described. Not all of the 58.5 million arrivals are still in the U.S. in 2015. Using the population projection model, it is possible to estimate how many of these immigrants arriving over the 50-year period were still in the U.S., how many had died and how many had left the country. Of the 58.5 million arrivals, about 10.8 million had emigrated from the U.S. and 4.3 million died. The remaining 43.4 million represent about 97% of the 2015 foreign-born population.
Projected Immigration, 2015-2065
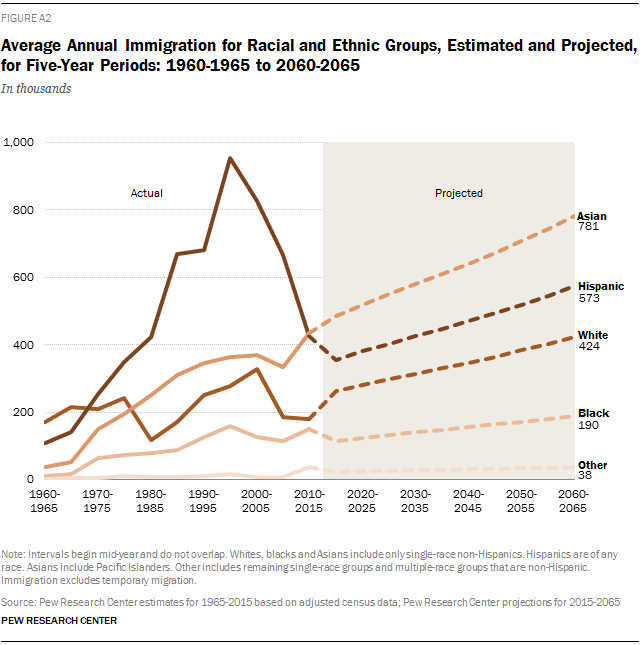
The future levels of immigration assumed for these projections incorporate both short-term and long-term trends. Since the mid-1990s, total immigration flows of Hispanics have declined quite sharply—dropping by more than half from about 950,000 per year to about 425,000 per year. The rate of decrease has slowed substantially, but our short-term projection for 2015-2020, which incorporates annual data for recent years, assumes a slight further decrease to about 355,000.
The other large flows in recent years have been Asian immigrants. Here, the absolute flows increased from about 365,000 per year in the late 1990s to 435,000 for 2010-2015 with most of the increase occurring in recent years. Again, the short-term annual changes point the way to a continuation of this trend so we are projecting an increase to about 485,000 for the 2015-2020 period.
Overall then, our projection for 2015-2020 is about 1.2 million immigrants per year or approximately the same as during the 2010-2015 period.
This projected immigration for 2015-2020 represents about 3.7 new immigrants annually per 1,000 people in the country. Viewed in this way— as a rate, immigration flows are projected to be lower than any time since the early 1970s when average annual immigration of less than 700,000 (Figure A1) represented about 3.3 new immigrants per 1,000 people. Over the long history where U.S. immigration has been measure, going back to 1820, the immigration rate averaged about 4.4 immigrants annually per 1,000 people (Passel and Cohn, 2008).
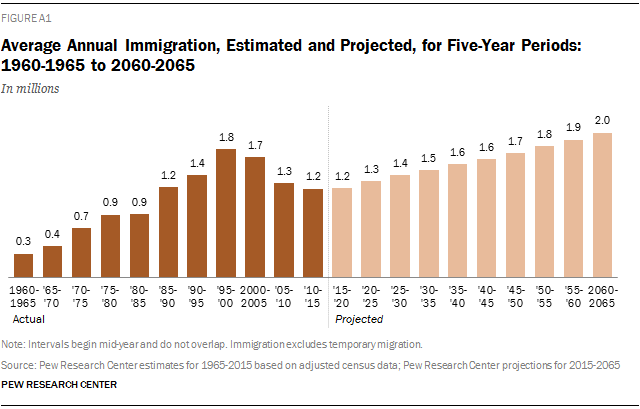
In the longer-range projections for this report, we took into account the immigration rate over the very long term and over the last 40 years. Further, the projected aging of the U.S. population through 2030 inherent in these projections points to a decrease in the share of the U.S. population in the working ages that would be slowed somewhat with increased immigration flows. Thus, immigration levels after 2020 are projected to increase for the next 10 years at a rate slightly above the population growth rate and then after 2030 to increase by about 1% per year, or a rate equivalent to the overall U.S. growth rate over the last 30 to 50 years. With these assumptions, by 2060-2065, the immigration rate will return to a level slightly below the rates over the last 40 years (4.6 per 1,000 versus 4.8). The average number of immigrants per year will climb from about 1.2 million during 2010-2015 to 1.5 million for 2030-2035 to about 2.0 million in 2060-2065 (Figure A1). The projected percentage increases in immigration flows after 2020 are applied to all race/Hispanic origin groups. Consequently, Asian immigration will continue to be higher than Hispanic immigration, and these two groups will account for a large majority of future immigration flows (Figure A2).
Other Components
In addition to the inflows of immigrants, there are several other much smaller flows that are part of a full demographic model of the U.S. population: net temporary migration (a first-generation flow), net movement from Puerto Rico (a flow into the Puerto Rican-born population), net movement of civilian citizens (a flow into the U.S.-born population) and flows accounting for the U.S. armed forces abroad. Each is treated somewhat differently in both the historic population estimates and the projections.
Temporary migration consists mainly of foreign-born people admitted for temporary residence in the U.S for periods of one year or longer. The two largest groups of temporary migrants are foreign students (mainly in colleges and universities) and guest workers (mostly with advanced degrees of special skills). For this temporary group, there tend to be large numbers entering every year and somewhat smaller numbers leaving. Over the last 25 years (since 1990), about 700,000 more temporary migrants have arrived than departed, representing a net increase in the foreign-born population of about 28,000 per year. In recent years the numbers have been increasing by about 1% per year; this rate of increase is assumed to continue to 2050, at which point the flows are assumed to level off. This temporary flow is dominated by Asians who account for almost three-quarters of net temporary migration since the mid-1990s. This flow is treated as part of the total immigration flow discussed above. (See Passel and Cohn, 2008 for a description of data sources for this population.)
The flow into the population born in U.S. territories is largely Hispanic (almost 90% for 1965-2015) and is dominated by movement between Puerto Rico and the United States. For the historic population estimates, the flow into the Puerto Rican-born population was estimated with the iterative process of adjusting initial estimates (in this case from the Census Bureau’s population estimates) to flows required by the benchmark populations. For 1965-2015, net movement into the Puerto Rican-born population amount to almost 1.6 million people or 30,000 per year. Flows have been much higher recently, especially from Puerto Rico to the U.S. (Cohn, Patten and Lopez, 2014). For the projections, this flow is assumed to increase by about 25% for 2015-2020 (to 190,000) over the 2010-2015 levels. It is assumed to remain at this level for the next five years and then decrease slowly to about 130,000. The assumed decrease is a result largely of projected drops in the number of people in Puerto Rico who might migrate, a trend that is a consequence of past outmigration and very low levels of fertility in Puerto Rico.
The projections shown here are for the population residing in the United States. Members of the U.S. military serving outside the country are not part of the resident population, but they almost all came from the resident population before they were sent abroad. To take this group into account, we use estimates of the U.S. military abroad from the Census Bureau (e.g., U.S. Census Bureau 2014) that are available for our estimate dates (i.e., every five years from 1960 to 2015). The data on the armed forces outside the U.S., which are available by age, sex and race/Hispanic origin, are distributed to generation groups using data on the military population residing in the U.S., which comes from the IPUMS census files. The estimate for the initial estimate date in an interval (e.g., 1960) is added to the population before the demographic component rates are applied; then, the estimated figures for the final estimate date (e.g., 1965) are subtracted to give the resident population at the final estimate date. This procedure is used for the historical estimates and for the projections. In the projections beyond 2015, the size and age-sex-race/Hispanic origin-generation distribution of the military overseas is held constant at the 2015 level—a total of about 275,000.
Two other components—net recruits plus deaths to the armed forces overseas and net movement of civilian citizens—have almost no impact on the estimated or projected population. They represent, on average, less than 5,000 people per year and mainly affect the third-and-higher generation which numbers about 240 million currently. For the projection, values are set to the average over the last 20 years and assumed to change in concert with the third-and-higher generation.
Emigration
Emigration of legal immigrants has proved to be another elusive component of population change. The measures used in the historical analysis incorporate revised measures based on variations of “residual” calculations using successive censuses to incorporate the detailed census figures on the foreign-born population (Passel, 2004, has a detailed description of the estimation methodology), as well as estimates used in previous Pew Research Center projections (Passel and Cohn, 2008) and new Census Bureau research for their population projections (U.S. Census Bureau 2014). The new Census Bureau measures, which rely on repeated estimates of emigration by duration of residence from successive ACS data sets, provide rates of emigration by sex for recent arrivals (less than 10 years in the U.S.) and those with 10 or more years in the U.S., separately for Hispanic and non-Hispanic immigrants.
Because emigration rates for recent arrivals are much higher than for longer-term immigrants, we revised the methods used for Pew Research Center estimates and projections to keep track of immigrant arrival cohorts. First, we divided the foreign-born population at each date into three groups based on duration of residence—those in the U.S. for less than five years, those in the U.S. for five to 10 years and those in the U.S for 10 years of more. To carry the foreign-born population forward for the next five years, we applied mortality and emigration rates to each of these groups. Mortality rates were the same for all three groups, but the emigration rates applied to latter two groups were the lower, long-term emigration rates. The survivors of the groups in the U.S. for five to 10 years and for 10 years or more at the initial date were combined into the group at the final date who had been in the country for 10 years or more. To illustrate with a specific example, the foreign-born in 1980 who had been in the U.S. for five to 10 years came in 1970-1975 and those who had been in the U.S. for more than 10 years had come before 1970; the survivors of these two groups who had not emigrated by 1985 represented the foreign-born population that had come to the U.S. before 1975 or the group who, in 1985, had been in the country for 10 or more years.
The higher short-term emigration rates are applied to the foreign born in the U.S. for less than five years at the initial date (e.g., those in 1980 who had come to the U.S. during 1975-1980 in our example). This group at the end of the estimation period (1985) becomes the group in the U.S. for five to 10 years. The new immigrants who arrive during the estimation interval (1980-1985) also are subject to the higher, short-term emigration rates and become the group with less than five years in the U.S. at the end date (e.g., 1985). This procedure of moving the foreign-born population in each duration-of-residence category to the next one over each five-year period is used in the historic estimates and the projections.
Emigration levels increased steadily for most groups from the early 1960s, when the annual average was about 150,000 through the late 1990s, when it was about 275,000. In large part because of the Great Recession of 2007-2009, emigration rates and emigration levels increased for the 2005-2010 period, especially for the Hispanic population. Overall emigration for the five-year period averaged just under 400,000. The Hispanic emigration rate went up by about 50 percent from 44 per 1,000 during 2000-2005 to 62 per 1,000 for 2005-2010. For 2010-2015, emigration rates dropped slightly and average annual emigration dropped to about 350,000. The number of short-term immigrants (i.e., those with the highest emigration rates) had decreased because of the downturn in new immigration so emigration decreased in absolute numbers.
Going forward from 2015, we applied the Census Bureau’s emigration rates without any adjustments beyond the distribution to more detailed age groups. These rates yielded lower levels of emigration for 2015-2020 (about 220,000 per year) than the levels observed in the historic estimates for 1990 and later. Emigration is projected to increase steadily to about 370,000 per year for the 2060-2065 population because of the increasing size of the foreign-born population and the growth in the number of new immigrants.
Fertility
Historical Fertility, 1960-2015
The fertility patterns used in the historical population estimates are drawn from a number of disparate sources. The overall patterns that emerge are relatively consistent across time. Fertility rates for foreign-born women within a race/Hispanic group are generally higher than rates for U.S.-born women. Generally, rates for second-generation women are between those of immigrant women and third-and-higher generation women.
For most of our analysis, the fertility measure used (and reported here) is the total fertility rate (TFR). TFR is an age-standardized measure that can be interpreted as the average lifetime births per woman. Because we have data over a considerable time period, we can report and analyze the TFR in a given year (i.e., the period TFR) which is the sum of the age-specific birth rates across all women during the year, and the cohort TFR which follows cohorts of women over time throughout their childbearing years. The number of births in a year and over time can be affected both by the level of the TFR and by the underlying age pattern of fertility (e.g., whether childbearing in a cohort is concentrated in younger or older ages). Over time in the U.S., there has been a trend to later childbearing, which is captured by increases in the mean age at which women give birth.
A major source for developing the historic measures of fertility is data from the June Supplements to the CPS, which ask questions on date of birth for the most recent child and number of children ever born. CPS supplements for June 1995 and for even-numbered years for June 1996-2010 permit tabulation of births by age for the full five “generations” we defined initially; the sample sizes are quite small for many of the groups so it is necessary to aggregate some categories across multiple years to compute reliable TFRs. The same June CPS Fertility Supplements collect information on children ever born through 2014. These data permit an assessment of lifetime births (essentially) for cohorts that have reached ages beyond 40. (An earlier CPS fertility supplement in June 1986 has some of the same information, but the sample sizes are quite small for many groups.)
The ACS asks women if they had a birth with in the 12 months before they responded to the survey. These data can be used to estimate fertility rates for foreign-born, Puerto Rican-born and U.S.-born women. Because the ACS has a very large sample size (1% of the US population in 2005 and later), generally reliable age-specific rates and TFRs can be estimated for all race/Hispanic groups, even those seriously underrepresented in the CPS. Finally, census data from 1960-1990 provide information on lifetime births. For 1960 and 1970, data can be developed for the full five-generation categorization of women; for 1980 and 1990, it can be developed for the more restricted three generations as with the ACS. Because the data are available across a 30-year period, it is possible to follow birth cohorts over time and develop estimates of completed lifetime births and some age patterns of fertility.
From these disparate data sources, we pieced together an initial set of period TFRs by race/Hispanic origin and generation for 1960 through 2013. Two other sets of estimates were also available—those from Passel and Edmonston (1994) for 1960-1990 and from Passel and Cohn (2008) for 1960-2005. These combined datasets provided the basic input for the historic analysis of generational fertility.
In developing the final fertility estimates for the historical data, we imposed a number of constraints on the resulting TFRs. First, the total number of births in each five-year period (1960-1965 through 2005-2010) had to agree with totals of registered births from the National Center for Health Statistics—by racial/ethnic group when available. Also, the survivors of births at the end of each estimation period had to agree with the totals for the appropriate age group in the benchmark populations. For example, births during 1960-1965, when survived to 1970, had to agree with the U.S. population ages 5-9 years in the 1970 benchmark; similarly births in 1965-1970 survived to 1970 had to agree with the U.S. population younger than 5 in 1970; births for 2000-2005 had to agree with the U.S. population younger than 5 in the 2005 benchmark population. This agreement with benchmarks was only required for the “first” benchmark; thus, survivors of births for 1960-1965 were not required to agree with the population aged 15-19 in 1980 or 25-29 in 1990. Then, finally, the generational distribution of the surviving births at the first benchmark were required to agree with the estimated mainland-born populations of the second and third-and-higher generations at the first benchmark.
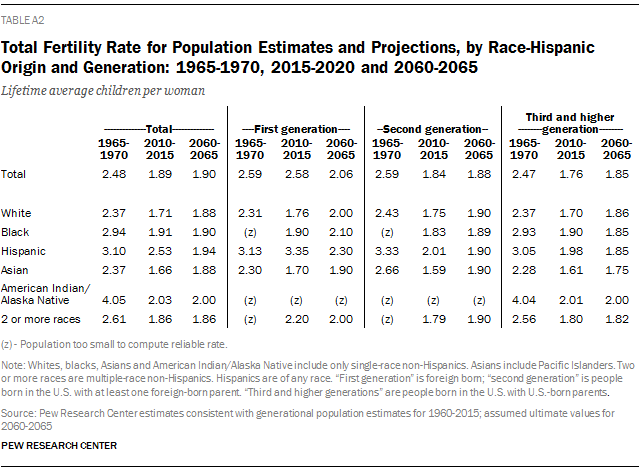
The total fertility rates resulting from of this iterative fitting process are shown for 1965-1970 and 2010-2015 in Table A2. Consistent with other data on births and fertility rates, the estimates show sizeable drops in the TFR for all race/Hispanic groups. The TFR increased for Hispanic immigrant women while other groups showed decreases; this anomalous pattern probably reflects a significant change in composition of Hispanic immigrants between 1970 and 2015 as well as differences in the recency of arrival. In general, second-generation women had lower TFRs than immigrant-women in the same group; by 2010-2015, differences between the second generation and third-and-higher generations were not large and not consistently in one direction. Data for 2005-2010 are not shown, but previous Pew Research Center analyses have documented notable declines in fertility following 2007, with especially large drops among immigrant women (Livingston and Cohn, 2012). These declines appear to have continued past 2010 and are reflected in the historical fertility patterns, especially for Hispanic and Asian immigrant women.
In implementing the multigeneration projection methodology, a “G-matrix” is required to distribute the births of mothers in each generation to a generation for the children. Births to immigrant mothers always go into the second generation, and all births to Puerto Rican-born women go into the Puerto Rican-parentage population. For the second and third-and-higher generations, some births are distributed back to the second generation as a result of cross-generational childbearing of mixed-generation couples made up of first-generation men and second generation or third-and-higher generation women. This matrix is estimated for each race group using data on mixed-generation couples from the Current Population Surveys for 1995–2010. Analysis of the initial G-matrices showed a strong relationship between the percentage of cross-generational births and the relative sizes of the generations. Accordingly, this relationship is built into the historical analyses and prospective projections to allow for dynamic changes in cross-generational marriage patterns.
Projected Fertility, 2015-2065
The overall patterns of fertility for the projections are driven by the initial values for 2010-2015 and a set of assumed “ultimate” fertility values for 2060-2065. The basic assumption is an overall convergence of fertility levels across generations and race/Hispanic groups. The ultimate values cluster around 1.9 children per woman. Immigrant women are assumed to have slightly higher ultimate rates (by about 0.1-0.2 children per woman). Hispanic immigrants are assumed to continue to have higher fertility but their TFR is projected to drop from about 3.3 to 2.3 lifetime births. Asian women tend to have lower project fertility with third-and-higher generation women having a projected TFR of 1.7; note that this implies an increase from their estimated fertility level in 2010-2015 of 1.6.
The age patterns for current and ultimate fertility are drawn from the recent Census Bureau (2014) projections that show differential age patterns over time and across groups. Once the initial and ultimate levels and patterns were determined, the intermediate projected fertility rates were developed by imposing smooth trends on cohorts, not on the time period TFRs. The cohorts reaching 25-29 in 2065-2070 (i.e., women born in 2040-2045) are assumed to have the ultimate level and age-pattern of fertility for their race/Hispanic origin group. Fertility projections were developed for 30 groups of women (five generations for six race/Hispanic groups). Some groups have increasing TFRs; others, decreasing; and a few, relatively constant. Notwithstanding the complex pattern of changes assumed, the TFR for the total population stays within a very narrow range, going from 1.89 in 2010-2015 to 1.90 for 2060-2065, and never exceeding 1.96.
Mortality
Survival rates by age, sex and race/Hispanic origin are drawn directly from recent Census Bureau (2014) population projections and official life tables for 1959-61 through 2010. The Census Bureau projections provide estimates of projected deaths (by single year of age for males and females) for every year from 2014 through 2060 for race/Hispanic groups that correspond well with those in the Pew Research Center projections—Hispanics; non-Hispanics for single race white; single races for black, Asian, Native Hawaiian and other Pacific Islanders and American Indians and Alaska Natives; and for people of two or more races. In addition, the projected populations corresponding to the projected deaths are available for the same groups by single ages and sex for every year through 2060.
From the death and population data, we constructed full life tables for every year; then we condensed them to abridged life tables. From these life tables, we estimated five-year survival rates for five-year age groups with standard life table methods. For the first nine five-year periods in our projections (e.g., 2015-2020 through 2055-2060), five-year survival rates were derived by averaging the rates from the starting year and the final year (e.g., 2015 and 2020 for the 2015-2020 period). For our final projection interval (2060-2065), the rates from the 2060 life table were used. In applying the rates from the Census Bureau life tables, the Hispanic and non-Hispanic white rates were applied to those groups in the projections; for the other groups of non-Hispanics in the projection, the rates for the full group (including Hispanics) from the Census Bureau-based life tables were used.
For the historic period of 1960 through 2015, not as much race/Hispanic origin detail is available in the mortality data. For 2014 and 2015, the Census Bureau projections provide the full detail just described. Official life tables for Hispanics are only available for 2006 and later; similarly, life tables for non-Hispanic whites and blacks only cover 2006 and later. There are no official life tables for Asians, American Indians and Alaska Natives or the two or more races population for any of the years. For years where life tables for Hispanics are not available, survival rates for whites and blacks are assumed to apply to the non-Hispanic single-race populations of whites and blacks, respectively; for these same years, survival rates for whites are assumed to apply to Hispanics. When Asian or two or more races populations are not available (i.e., all years before 2014), survival rates from the white population (non-Hispanic, if available) are assumed to apply to the Asian and two or more races populations. For the American Indian and Alaska Native population, survival rates for the group labeled “other than white” are assumed to apply.
The final step in the process of deriving the five-year survival rates involves developing those estimates for specific years and then averaging across the years to get rates applicable to the projection intervals. For 1960, rates were developed from the U.S. Life Tables: 1959-61 (NCHS, 1964); for 1970, from United States Life Tables: 1969-71 (NCHS, 1975); for 1980, from U.S. Decennial Life Tables for 1979-81 (NCHS, 1985); for 1990, from U.S. Decennial Life Tables for 1989-91 (NCHS, 1997); for 2000, from U.S. Decennial Life Tables for 1999-2001 (NCHS, 2008), for 2005, from United States Life Tables by Hispanic Origin (NCHS, 2010 ); and for 2010, from United States Life Tables, 2010 (NCHS, 2014. (Note that the survival rates from the 2006 life tables are assumed to apply to2005 in the estimation process.) For each interval in the historic estimates, survival rates were estimated by averaging the nearest surrounding life tables. So, for 1960-1965, the estimated survival rates were weighted average of the relevant 1960 rates (with a weight of 3.0) and the 1970 rates (with a weight of 1.0); for 1965-1970, the same rates were averaged, but the weights reversed. Finally, for 2010-2015, the survival rates for 2015 from the Census Bureau projections were averaged with the rates from the 2010 official life tables.
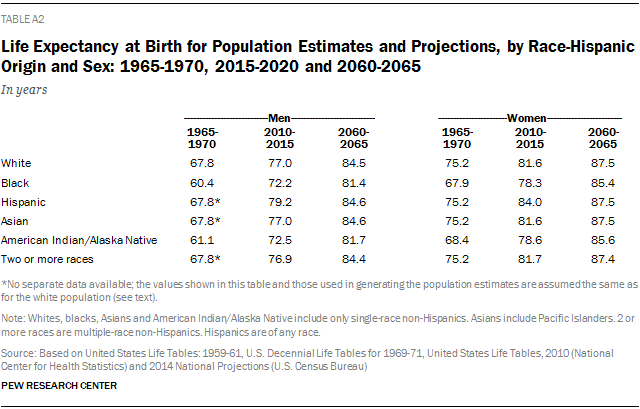
Estimates of life expectancies at birth from the averaged life tables used in the population estimates and projections are shown in Table A3. There are large improvements for all groups between 1965-1970 and 2010-2015—nine to 12 years for men and six to 10 years for women. Between 2010-2015 and 2060-2065, all groups show improvements in life expectancy at birth, but not generally as large as the gains over the preceding 50 years. For men, life expectancies improve by another five to nine years and for women, three to seven years. By 2060-2065, female life expectancy at birth is in a range of 85-88 years; for men, the range is 81-84 years.
Contributions to Population and Growth
The contribution of immigration to population growth goes beyond just the numbers of immigrants added to the population because once the immigrants have arrived in the country, they tend to have children in the U.S. In the long run, the immigrants themselves will die, but their U.S.-born offspring will multiply, having children themselves, grandchildren, and subsequent generations. The use of a population projection methodology permits measurement of future contributions of immigrants to population growth as well as an assessment of the role of past immigration in population change.
In measuring the contribution of future immigration to the projected population in 2065 (or any other future date), an alternative population projection is carried out by setting future immigration (after 2015) to zero. In these projections, there are two components of immigration—total immigration, consisting of combined legal and unauthorized immigration, and net temporary migration—that are set to zero. With this assumption, not only are no future immigrants added to the population, there is no other contribution from these immigrants to population change through future births, deaths, or emigration because all of these components are computed by applying rates to the population. The difference between the “zero immigration” projection and the baseline projection represents the contribution of future immigrants to future population change at any future date. (To isolate the “pure” impact of future immigration, the G-matrices used to allocate births across generations are not allowed to vary dynamically but are fixed at the values of the baseline projection.)
Following the work of Passel and Cohn (2008) and Passel and Edmonston (1994), this same methodology can be used to assess the contribution of past immigration to past population change because the time series of historical population estimates was developed with the population projection methodology. Thus, past immigration can be set to zero to estimate what would have happened in the past had there been no immigrants during the 1965–2015 period or during any other historical interval. This methodology works because the time series of population change has been constructed with rates of fertility, mortality, and emigration rather than past numbers of births, deaths, and emigrants. (Again, the G-matrix values are fixed at the values from the historical benchmark population estimates.)
Recent Arrivals: Data Sources
Most of the analysis in this chapter is based on the 1970 to 2000 decennial census public use files and the 2007 and 2013 American Community Survey (ACS) public use files. The ACS is an ongoing survey that was developed by the Census Bureau to provide decennial census information on an annual basis. The ACS questionnaire is similar to the 2000 census questionnaire, with some added questions, and information collected by the ACS is consistent with the earlier decennial censuses.
The public use files utilized are the Integrated Public Use Microdata Series provided by the University of Minnesota Population Center. Documentation can be found at https://usa.ipums.org/usa/.
The 1980, 1990 and 2000 files used are the 5% samples. For 1970, six independent 1% samples are available. However, critical information on citizenship status (needed to identify if the person is foreign born) is available only in the Form 1 samples. So the 1970 file used is a 3% sample. The ACS files are 1% samples.
Recent Arrivals
For foreign-born persons who arrived within five years of the census or survey date, all the observations were utilized. Since the U.S.-born population is much larger, random subsamples of U.S.-born respondents were used to expedite processing times. For 1970, a 1% sample of the U.S.-born population was used. For 1980, 1990 and 2000, a 0.5% subsample of U.S.-born respondents was employed. All the U.S.-born respondents from the ACS samples were included in the analysis. The population weights were adjusted to reflect the subsampling, and all the published figures are weighted. The unweighted sample sizes used in the tabulations are as follows:
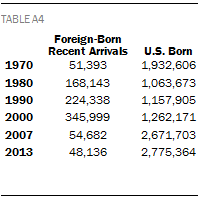
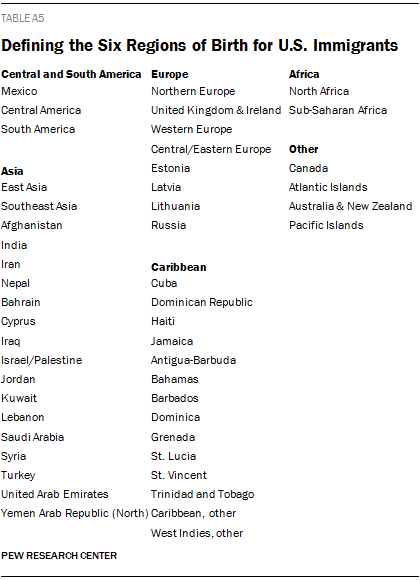
The following table shows the countries included in each of the six regions of birth:
Educational Attainment
In 1990, the Census Bureau redesigned the question on educational attainment. Until 1990, the question ascertained the highest year of school completed. Since 1990, years of school completed is available only for those who have not completed high school. For persons who have at least completed high school, the questionnaire queries as to the highest degree completed.
Before 1990, the number of years of college completed beyond four is available but the question did not query whether the respondent completed an advanced degree, so information on graduate degrees is not comparable before and after 1990.
To bridge the education questions over time, standard practice is employed, and respondents before 1990 who have completed 12 years of schooling are assumed to have completed high school. Respondents who have completed four years of college are assumed to have finished at least a bachelor’s degree. Persons indicating that they attended less than one to three years of college are assigned to those who completed at least some college or a two-year degree. For more details, see https://usa.ipums.org/usa-action/variables/EDUC#comparability_section.
Survey Data: The American Trends Panel Surveys
The American Trends Panel (ATP), created by the Pew Research Center, is a nationally representative panel of randomly selected U.S. adults living in households. Respondents who self-identify as internet users (representing 89% of U.S. adults) participate in the panel via monthly self-administered Web surveys, and those who do not use the internet participate via telephone or mail. The panel is being managed by Abt SRBI.
Data in this report are drawn from the March wave of the panel, conducted March 10-April 6, 2015 in English and Spanish among 3,147 respondents (2,833 by Web and 314 by mail). The margin of sampling error at the 95% confidence level for the full sample of 3,147 respondents is plus or minus 2.4 percentage points.
All current members of the American Trends Panel were originally recruited from the 2014 Political Polarization and Typology Survey, a large (n=10,013) national landline and cellphone random digit dial (RDD) survey conducted from Jan. 23 to March 10, 2014, in English and Spanish. At the end of that survey, respondents were invited to join the panel. The invitation was extended to all respondents who use the internet (from any location) and a random subsample of respondents who do not use the internet.26
Of the 10,013 adults interviewed, 9,809 were invited to take part in the panel. A total of 5,338 agreed to participate and provided either a mailing address or an email address to which a welcome packet, a monetary incentive and future survey invitations could be sent. Panelists also receive a small monetary incentive after participating in each wave of the survey.
The ATP data were weighted in a multistep process that begins with a base weight incorporating the respondents’ original survey selection probability and the fact that some panelists were subsampled for invitation to the panel. Next, an adjustment was made for the fact that the propensity to join the panel and remain an active panelist varied across different groups in the sample. The final step in the weighting uses an iterative technique that matches gender, age, education, race, Hispanic origin and region to parameters from the U.S. Census Bureau’s 2013 American Community Survey. Population density is weighted to match the 2010 U.S. Decennial Census. Telephone service is weighted to estimates of telephone coverage for 2014 that were projected from the July-December 2013 National Health Interview Survey. It also adjusts for party affiliation using an average of the three most recent Pew Research Center general public telephone surveys, and for internet use using as a parameter a measure from the 2014 Survey of Political Polarization. Sampling errors and statistical tests of significance take into account the effect of weighting. The Hispanic sample in the American Trends Panel is predominantly U.S. born and English-speaking.
In addition to sampling error, one should bear in mind that question wording and practical difficulties in conducting surveys can introduce error or bias into the findings of opinion polls.
The Web component of the March wave had a response rate of 78% (2,833 responses among 3,634 Web-based individuals enrolled in the panel); the mail component had a response rate of 61% (314 responses among 512 non-Web individuals enrolled in the panel). Taking account of the response rate for the 2014 Survey of Political Polarization (10.6%) and attrition from panel members who were removed at their request or for inactivity, the cumulative response rate for the March ATP wave is 3.4%.27
Statistical Portrait: Data Sources
The statistical profile of the foreign-born population in the 50 states and the District of Columbia is based on Pew Research Center tabulations of the Census Bureau’s 2010 and 2013 American Community Survey (ACS) and the 1960-2000 decennial censuses.
The ACS is the largest household survey in the United States, with a sample of more than 3 million addresses (http://www.census.gov/acs/www/methodology/sample_size_data/index.php). It covers the topics previously covered in the long form of the decennial census. The ACS is designed to provide estimates of the size and characteristics of the resident population, which includes persons living in households and group quarters. For more details about the ACS, including the sampling strategy and associated error, see the 2010 or 2013 American Community Survey’s Accuracy Statement provided by the U.S. Census Bureau: http://www.census.gov/acs/www/data_documentation/documentation_main/.
The specific data sources for this statistical profile are the 1% samples of the 2010 and 2013 ACS Integrated Public Use Microdata Series (IPUMS) provided by the University of Minnesota, the 5% samples of the 1980-2000 decennial censuses, a merged 3% sample of the 1970 decennial census (Form 1), and the 1% samples of the 1960 decennial census. The IPUMS assigns uniform codes, to the extent possible, to data collected by the decennial census and the ACS from 1850 to 2013. For more information about the IPUMS, including variable definition and sampling error, please visit http://usa.ipums.org/usa/design.shtml.
Due to differences in the way in which the IPUMS and Census Bureau adjust income data and assign poverty status, data provided on these topics might differ from data on these variables that are provided by the Census Bureau.
For the purposes of this statistical portrait, the foreign born include those persons who identified as naturalized citizens or non-citizens and are living in the 50 states or the District of Columbia. Persons born in Puerto Rico and other outlying territories of the U.S. and who are now living in the 50 states or the District of Columbia are included in the U.S.-born population.


