 An estimated 1.8 million Hispanics of Dominican origin resided in the United States in 2013, according to a Pew Research Center analysis of the Census Bureau’s American Community Survey.
Dominicans in this statistical profile are people who self-identified as Hispanics of Dominican origin; this means either they themselves are Dominican immigrants or they trace their family ancestry to the Dominican Republic.
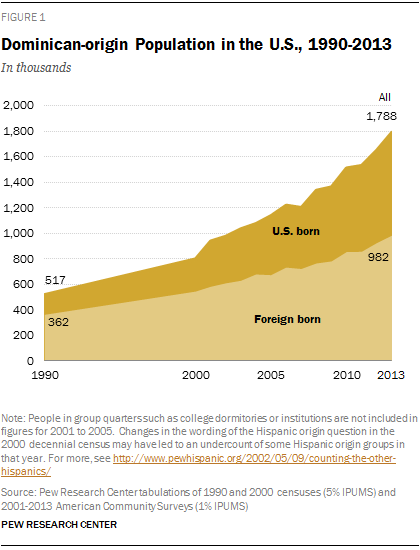
Dominicans are the fifth-largest population of Hispanic origin living in the United States, accounting for 3.3% of the U.S. Hispanic population in 2013. Since 1990, the Dominican-origin population has more than tripled, growing from 517,000 to 1.8 million over the period. At the same time, the foreign-born population of Dominican origin living in the U.S. grew by 171%, up from 362,000 in 1990 to 982,000 in 2013. In comparison, Mexicans, the nation’s largest Hispanic origin group, constituted 34.6 million, or 64.1%, of the Hispanic population in 2013.1
This statistical profile compares the demographic, income and economic characteristics of the Dominican population with the characteristics of all Hispanics and the U.S. population overall and includes public opinion data of Dominican and Hispanic adults. It is based on Pew Research Center tabulations of the 2013 American Community Survey and Pew Research Center’s 2013 National Survey of Latinos. Key facts include:
- Immigration status. More than half of the Dominicans (55%) in the United States are foreign born, compared with 35% of Hispanics and 13% of the U.S. population overall. Four-in-ten immigrants from the Dominican Republic have been in the U.S. for over 20 years. Half of Dominican immigrants are U.S. citizens.
- English proficiency and speaking Spanish at home. According to the ACS, a majority (57%) of Dominicans ages 5 and older speak English proficiently.2 The other 43% of Dominicans report speaking English less than very well, compared with 32% of all Hispanics. Overall, 88% of Dominicans speak Spanish at home, higher than the share (73%) of all Hispanics ages 5 and older who speak Spanish at home.
- Bilingualism and language dominance. According to the 2013 Pew Research Center survey, one-in-ten Dominican adults are English-dominant, lower than the share of Hispanics overall (25%).3 About half of Dominican adults (48%) are Spanish-dominant, and roughly four-in-ten (43%) are bilingual. About four-in-ten (38%) Hispanic adults are Spanish-dominant, and 36% of Hispanic adults are bilingual speakers. For Dominican immigrants, about half (53%) are Spanish-dominant, while 44% are bilingual. Only 3% of Dominican immigrants are English-dominant.
- Age. Dominicans are younger than the U.S. population and have the same median age as Hispanics overall. The median age of Dominicans is 28; the median ages of the U.S. population and all Hispanics are 37 and 28, respectively. Among Dominicans, the median age of immigrants is 43 years, while it’s 15 years among the U.S. born.
- Marital status. Dominicans ages 18 and older are less likely to be married (37%) than Hispanics overall (46%) and the U.S. population overall (50%). Among Dominicans ages 18 and older, the foreign born are more likely to be married than the U.S. born—44% vs. 21%.
- Fertility. Fewer than one-in-ten (7%) Dominican women ages 15 to 44 gave birth in the 12 months prior to this survey. That was the same as the rate for all Hispanic women and similar to the overall rate for U.S. women (6%). Some 55% of Dominican women ages 15 to 44 who gave birth in the 12 months prior to the survey were unmarried. That was higher than the 45% rate for all Hispanic women and the 38% overall rate for U.S. women.
- Regional dispersion. About eight-in-ten Dominicans (79%) live in the Northeast, and nearly half (47%) live in New York.
- Educational attainment. Dominicans have higher levels of education than the U.S. Hispanic population but lower levels than the U.S. population overall. Some 17% of Dominicans ages 25 and older—compared with 14% of all U.S. Hispanics and 30% among the U.S. population—have obtained at least a bachelor’s degree. Among Dominicans ages 25 and older, the U.S. born are more likely to have earned a bachelor’s degree or more than foreign-born Dominicans—25% vs. 15%.
- Income. The median annual personal earnings for Dominicans ages 16 and older was $20,000 in the year prior to the survey — slightly lower than the median earnings for all U.S. Hispanics ($21,900) and lower than the median earnings for the U.S. population ($30,000).
- Poverty status. The share of Dominicans who live in poverty, 28%, is higher than the rate for the general U.S. population (16%) and slightly higher than the rate for Hispanics overall (25%).
- Health insurance. About two-in-ten Dominicans (21%) do not have health insurance, compared with 29% of all Hispanics and 15% of the general U.S. population. Some 8% of Dominicans younger than 18 are uninsured. (These data reflect insurance rates prior to the implementation of the individual insurance mandate of the Affordable Care Act.)
- Homeownership. The rate of Dominican homeownership (24%) is lower than the rate for all Hispanics (45%) and the U.S. population (64%) as a whole.
 “Dominican” is the identity term used most often. When asked in a 2o13 Pew Research Center survey what terms they use to describe themselves most often, two-thirds of Dominican adults (66%) say they most often use the term “Dominican.” Some 16% say they most often describe themselves as “American.” Roughly the same share (17%) most often use the pan-ethnic terms of “Hispanic” or “Latino” to describe their identity. By comparison, 54% of all U.S. Hispanics say they prefer their ancestor’s Hispanic origin term to describe their identity, 23% say they describe themselves most often as “American” and two-in-ten use the pan-ethnic terms of “Hispanic” or “Latino” to describe their identity.
- Preference for Hispanic or Latino. In regards to the pan-ethnic terms of “Hispanic” or “Latino,” six-in-ten Dominicans have no preference for either term. Among those who have a preference, more prefer the term “Hispanic” (29% of all Dominicans), while 11% prefer the term “Latino.” By comparison, half of all Hispanic adults have no preference for either term, and among those who do have a preference, Hispanic is favored over Latino 2-to-1.
 Typical American or not. When asked in the 2o13 Pew Research survey whether they thought of themselves as a typical American or very different from a typical American, about half of Dominican adults (53%) see themselves as a typical American, while four-in-ten think of themselves as very different from a typical American. Hispanic adults are more likely to see themselves as a typical American (49%) than very different from a typical American (44%).
- Religious affiliation. A 2013 Pew Research Center survey of Hispanic adults finds that about six-in-ten Dominican adults (59%) identify themselves as Catholic. Roughly two-in-ten (21%) Dominicans are Protestant, and among all Dominicans, 6% are mainline Protestants and 16% are evangelical Protestants. Some 16% of Dominican adults are religiously unaffiliated. In contrast, among all Hispanics 55% identify as Catholic, 22% identify as Protestant, and about two-in-ten (18%) are unaffiliated.
This statistical profile of Hispanics of Dominican origin is based on the Census Bureau’s 2013 American Community Survey (ACS) and a nationally representative Pew Research Center survey of 5,103 Hispanic adults conducted May 24-July 28, 2013. The survey was conducted in both English and Spanish on cellular as well as landline telephones and has a margin of error of plus or minus 2.1 percentage points. For a complete methodology, see: https://www.pewresearch.org/religion/2014/05/07/appendix-a-survey-methodology-2/
Like any survey, estimates from the ACS are subject to sampling error and (potentially) measurement error. Information on the ACS sampling strategy and associated error is available at http://www.census.gov/acs/www/methodology/methodology_main/. An example of measurement error is that citizenship rates for the foreign born are estimated to be overstated in the decennial census and other official surveys, such as the ACS (see Jeffrey S. Passel. 2007. “Growing Share of Immigrants Choosing Naturalization.” Washington, D.C.: Pew Research Center, March). Finally, estimates from the ACS may differ from the decennial census or other Census Bureau surveys due to differences in methodology and data collection procedures (see, for example, http://www.census.gov/hhes/www/laborfor/laborfactsheet092209.html and http://www.census.gov/hhes/www/poverty/about/datasources/factsheet.html).


