As the mix of offenses being convicted in federal courts has changed, so too has the demographic composition of sentenced offenders. Between 1992 and 2012, the share of sentenced offenders that are Hispanic has grown while the share that is non-Hispanic white or non-Hispanic black has decreased, even though the number of offenders in each group grew.
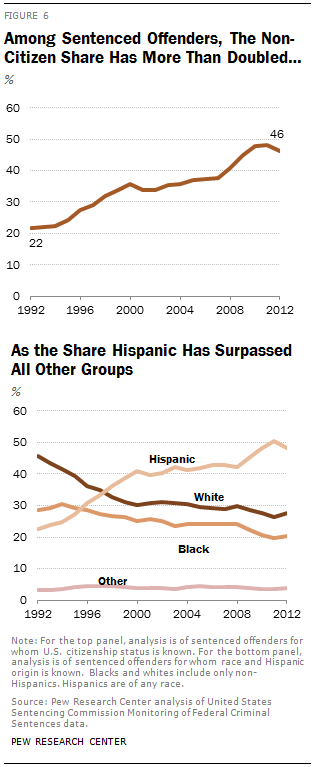
In 2012, 46% of offenders sentenced in federal courts lacked U.S. citizenship. This is a marked change from the composition of offenders sentenced in 1992, when only 22% of offenders were non-U.S. citizens. Of those sentenced offenders who lacked U.S. citizenship in 2012, 87%were unauthorized immigrants. The remaining 13% include legal immigrants (9%), non-U.S. citizens whose legal status is unknown (3%), and extradited aliens (1%).
The increase in immigration prosecutions has also significantly altered the racial and ethnic composition of the federal docket. In 2012, 48% of sentenced offenders were Latino, up from 23% in 1992. By contrast, the share of offenders who are non-Hispanic white was 27% in 2012, down from 46% in 1992. And the share of offenders who are non-Hispanic black was 20% in 2012, down from 29% in 1992.
Hispanic sentenced offenders were more likely to be non-U.S. citizens than any other group. Among Hispanics sentenced in 2012, 76% were non-U.S. citizens. By comparison, among non-Hispanic white and non-Hispanic black offenders, only small shares did not hold U.S. citizenship—15% and 6% respectively.
Non-citizen Hispanics, who make up 37% of sentenced offenders, represent the single largest demographic group among sentenced offenders—larger than the share of white or black offenders (regardless of citizenship). They also outnumbered all other minorities sentenced in federal courts combined (including non-Hispanic blacks, other race, and Hispanic U.S. citizens). By contrast, in 1992, non-citizen Hispanics represented only 16%of offenders, while whites comprised 46% and blacks represented 29% of offenders.


