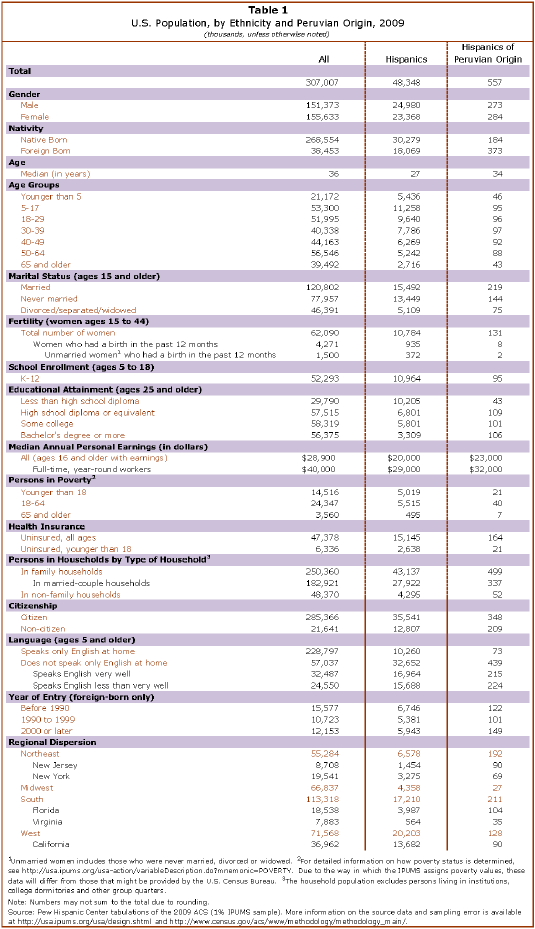
An estimated 557,000 Hispanics of Peruvian origin resided in the United States in 2009, according to the Census Bureau’s American Community Survey. Peruvians in this statistical profile are people who self-identified as Hispanics of Peruvian origin; this means either they themselves are Peruvian immigrants or they trace their family ancestry to Peru. Peruvians are the tenth-largest population of Hispanic origin living in the United States, accounting for 1.2% of the U.S. Hispanic population in 2009. Mexicans, the nation’s largest Hispanic origin group, constituted 31.7 million, or 65.5%, of the Hispanic population in 2009.1
This statistical profile compares the demographic, income and economic characteristics of the Peruvian population with the characteristics of all Hispanics and the U.S. population overall. It is based on tabulations from the 2009 American Community Survey by the Pew Hispanic Center, a project of the Pew Research Center.2 Key facts include:
- Immigration status. Two-thirds of Peruvians (67%) in the United States are foreign born compared with 37% of Hispanics and 13% of the U.S. population overall. Two-thirds of immigrants from Peru (67%) arrived in the U.S. in 1990 or later. More than four-in-ten Peruvian immigrants (44%) are U.S. citizens.
- Language. A majority of Peruvians (56%) speak English proficiently.3 Some 44% of Peruvians ages 5 and older report speaking English less than very well, compared with 37% of all Hispanics.
- Age. Peruvians are similar in age to the U.S. population and older than Hispanics overall. The median age of Peruvians is 34; the median ages of the U.S. population and all Hispanics are 36 and 27, respectively.
- Marital status. Peruvians are more likely than Hispanics overall to be married—50% versus 45%.
- Fertility. Three-in-ten Peruvian women (30%) ages 15 to 44 who gave birth in the 12 months prior to the survey were unmarried. That was less than the rate for all Hispanic women—40%—and the rate for U.S. women—35%.
- Regional dispersion. Peruvians are more geographically dispersed than other Hispanic origin groups. Two-in-ten Peruvians (19%) live in Florida and one-in-six (16%) live in California and in New Jersey (16%); some one-in-eight live in New York (12%).
- Educational attainment. Peruvians have higher levels of education than the Hispanic population overall. Some 29% of Peruvians ages 25 and older—compared with 13% of all U.S. Hispanics—have obtained at least a bachelor’s degree.
- Income. The median annual personal earnings for Peruvians ages 16 and older were $23,000 in 2009; the median earnings for all U.S. Hispanics were $20,000.
- Poverty status. The share of Peruvians who live in poverty, 12%, is similar to the rate of the general U.S. population (14%) and lower than the rate among all Hispanics (23%).
- Health Insurance. Three-in-ten Peruvians (29%) do not have health insurance compared with 31% of all Hispanics and 15% of the general U.S. population. Additionally, 15% of Peruvians younger than 18 are uninsured.
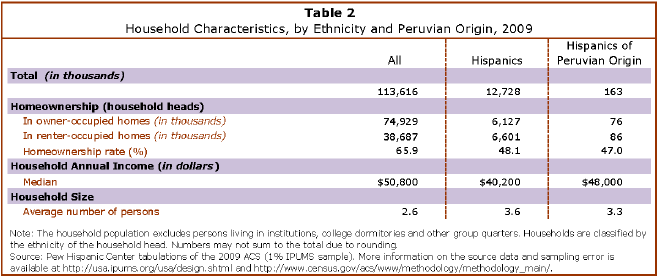
- Homeownership. The rate of Peruvian homeownership (47%) is similar to the rate for all Hispanics (48%) but lower than the 66% rate for the U.S. population as a whole.
About the Data
This statistical profile of Hispanics of Peruvian origin is based on the Census Bureau’s 2009 American Community Survey (ACS). The ACS is the largest household survey in the United States, with a sample of about 3 million addresses. The data used for this statistical profile come from 2009 ACS Integrated Public Use Microdata Series (IPUMS), representing a 1% sample of the U.S. population.
Like any survey, estimates from the ACS are subject to sampling error and (potentially) measurement error. Information on the ACS sampling strategy and associated error is available at http://www.census.gov/acs/www/methodology/methodology_main/. An example of measurement error is that citizenship rates for the foreign born are estimated to be overstated in the Decennial Census and other official surveys, such as the ACS (see Jeffrey Passel. “Growing Share of Immigrants Choosing Naturalization,” Pew Hispanic Center, Washington, D.C. (March 28, 2009)). Finally, estimates from the ACS may differ from the Decennial Census or other Census Bureau surveys due to differences in methodology and data collection procedures (see, for example, http://www.census.gov/acs/www/Downloads/methodology/ASA_nelson.pdf, http://www.census.gov/hhes/www/laborfor/laborfactsheet092209.html and http://www.census.gov/hhes/www/poverty/about/datasources/factsheet.html).