The majority of the analysis of Hispanics is based upon the Pew Hispanic Center 2010 National Survey of Latinos (NSL).1 This survey collected data via telephone interviews conducted by Social Science Research Solutions (SSRS), an independent research company, among a nationally representative sample of 1,375 Latino respondents ages 18 and older, from Aug. 17 to Sept. 19, 2010. For results based on the total sample, one can say with 95% confidence that the error attributable to sampling is plus or minus 3.3 percentage points.
For this survey, SSRS maintained a staff of Spanish-speaking interviewers who, when contacting a household, were able to offer respondents the option of completing the survey in Spanish or in English. A total of 548 respondents were surveyed in English and 827 respondents were interviewed in Spanish. Any male or female ages 18 or older of Latino origin or descent was eligible to complete the survey.
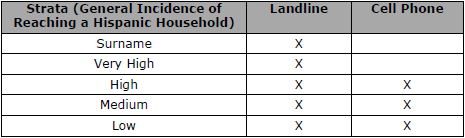
To address the growing number of Hispanic households in the U.S. that are reachable only by cell phone, the study included interviews from both landline (n=710) and cell phone (n=665) sample frames.
Both sample frames were stratified via a disproportionate stratified design. All telephone exchanges in the contiguous 48 states were divided into groups, or strata, based on their concentration of Latino households. For the landline frame, the sample was also run against InfoUSA and other listed databases, and then scrubbed against known Latino surnames. Any “hits” were subdivided into a “surname” stratum, with all other sample being put into four other “RDD” strata. The cell phone sample was divided into three strata. Overall, then, the study employed eight strata.
It is important to note that the existence of a surname stratum does not mean this was a surname sample design. The sample is RDD, with the randomly selected telephone numbers divided by whether they were found to be associated with or without a Latino surname. This was done simply to increase the number of strata and thereby increase the ability to meet ethnic targets and ease administration by allowing for more effective assignment of interviewers and labor hours.
A multistage weighting design was used to ensure an accurate representation of the national Hispanic population:
- An adjustment was made for all persons found to possess both a landline and a cell phone, as they were twice as likely to be sampled as were respondents who possessed only one phone type.
- The sample was corrected for the disproportionality of the stratification scheme described earlier.
- The sample was corrected for the likelihood of within-household selection, which depended upon the likelihood that the respondent’s age group would be selected, and that within that age group, the particular respondent would be selected.
- The sample was corrected to reflect the percentage that is cell-only, landline-only, or reachable by either a landline or a cell phone, based upon estimates for Hispanics from the 2009 National Health Interview Survey estimates projected to 2010.
- Finally, the data were put through a post-stratification sample balancing routine. The post-stratification weighting utilized national 2009 estimates from the Census Bureau’s Current Population Survey, March Supplement, on gender, education, age, region, foreign/native born status, year of entry into the U.S. and Hispanic heritage.
Non-Hispanic Data
The 2010 data on non-Hispanic whites and blacks is derived from the Pew Internet and American Life Project August 2010 Health Tracking Survey.2 The data were collected in telephone interviews conducted by Princeton Survey Research Associates International (PSRAI) from Aug. 9 to Sept. 13, 2010, among a sample of 3,001 adults, ages 18 and older. For results based on the total sample, one can say with 95% confidence that the error attributable to sampling is plus or minus 2.5 percentage points. More details on this survey can be found in the recent PIAL report “Americans Living with Disability and Their Technology Profile.”


