
Because Latinos are more likely than other Americans to either be under age 18, or non-citizens, or both, their share of the eligible electorate (8.9% in 2007) lags behind their share of the total U.S. population (15.5% in 2007).2 In addition, the turnout rate of Hispanic eligible voters in U.S. general elections has historically been lower than the turnout rates of black and white eligible voters. Since 1974, in presidential and midterm elections, the Latino eligible voter turnout rate has lagged behind white eligible voters by 13 to 20 percentage points. In 2004, the last presidential election year, 47% of Latino eligible voters reported having voted. In contrast, 60% of black eligible voters and 67% of white eligible voters reported voting in the 2004 presidential election. In 2000, a presidential election year without a presidential incumbent, the voter turnout rate among Latino eligible voters was 45%. Among white eligible voters, it was 62%, and among black eligible voters, it was 57%.
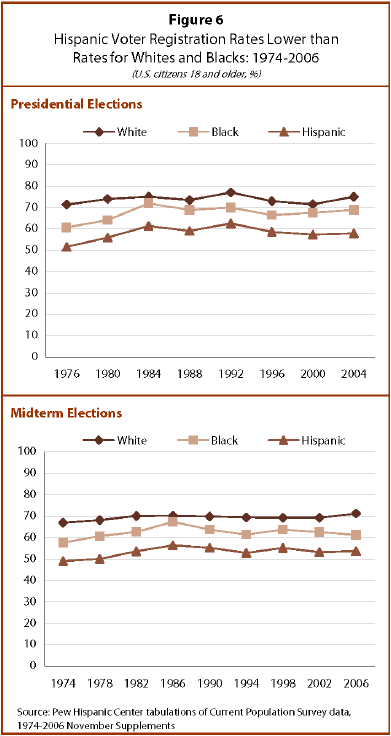
Similarly, voter registration trends among Latinos have lagged behind those of non-Latinos. In 2004, 58% of Latinos who were U.S. citizens reported that they were registered to vote, compared with a voter registration rate of 75% for whites and 69% for blacks. In 2006, a midterm election year, 54% of Latinos were registered to vote, compared to 71% for whites and 61% for blacks.
Participation in this Year’s Election Cycle
Latino participation appears to be on track to be higher this year than in 2004. While no overall national voter turnout rate estimates are available for the primaries, findings from state exit polls taken during the Democratic primaries show that Latino voters’ share of the vote increased in many states, with especially large increases in participation in California and Texas (Minushkin and Lopez, 2008). In addition, this new Pew Hispanic Center survey finds that 56% of Latino registered voters say they voted in the primaries this year, with 16% of registered voters reporting that they had voted for the first time.
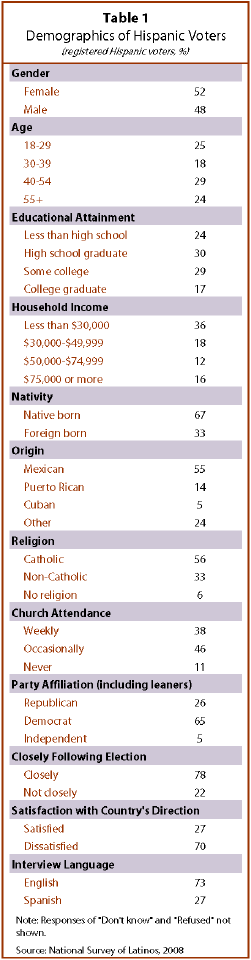
Two-thirds of Hispanic registered voters are native born (67%), and 33% are immigrants who are naturalized U.S. citizens. Younger Latinos ages 18 to 29 comprise 25% of all Hispanic registered voters, while older Hispanics ages 55 and older are 24% of all Hispanic registered voters. More than one-third (36%) of all Latino registered voters have household income of less than $30,000, and 28% have an income of $50,000 or more. Almost half (46%) have attended at least some college, but 24% do not have a high school diploma.
Latinos have participated in this election in ways other than voting in the primaries. Among registered voters, 15% say they have contributed money to a candidate running for office, half of them doing so via the Internet; 15% report having attended a political or campaign-related meeting; and 46% have used the Internet to find information about candidates.
Also, 78% of Latino registered voters say they are following the election very closely or somewhat closely, up from 60% in October 2007 and 72% in July 2004.
Latino registered voters are as likely as other registered voters to say that they intend to vote in the November presidential election. Among Latino registered voters, 94% say that they plan to vote in this year’s presidential election, compared with 95% of all registered voters who said the same thing in a recent survey by the Pew Research Center for the People and the Press 2008.
Latino Presidential Vote, 1992-2004
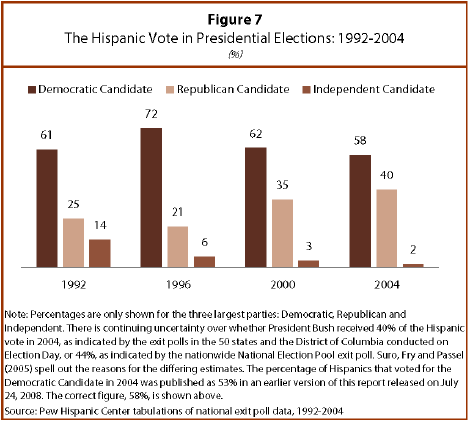
Over the past four presidential election cycles, Latino support for Democratic presidential candidates has ranged from 53% in 2004 to 72% in 1996. Support for Republican presidential candidates has ranged from 21% in 1996 to 40% in 2004.3

