One common explanation for the lagging math achievement of ELL students is that these students tend to have different income, demographic and family characteristics than do other students. This report focuses on another set of differences between ELL students and other students — the differences in the characteristics of the schools they attend.
Nationally, ELL students do not attend the same public schools as other students. At the elementary level, almost 70% of ELL students were educated in about 5,000 elementary schools, about 10% of the nation’s roughly 50,000 elementary schools. Only 13% of all elementary school students were enrolled in these 5,000 schools. Nearly half of the nation’s elementary schools educated no ELL students (Cosentino de Cohen, Deterding and Clewell, 2005).
It is not surprising that ELL students are concentrated in a subset of public schools, given the geographic concentration of students with limited English-speaking abilities. Census data show that almost 70% of public school students with limited English-speaking abilities reside in the six states with large ELL student populations (California, Texas, New York, Florida, Illinois and Arizona).
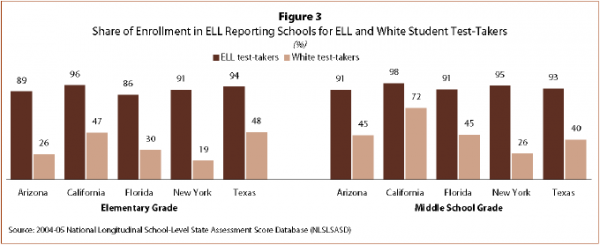
The NLSLSASD shows that ELL students who took proficiency assessment tests in each state were highly concentrated in a subset of elementary schools and middle schools. This report refers to that subset of schools as “ELL reporting schools.”7 For example, among third-grade math test-takers in California, 96% of ELL test-takers were enrolled at the 3,398 ELL reporting schools (Figure 3). In contrast, those 3,398 California ELL reporting schools educated less than half (47%) of the white test-takers. Perhaps reflecting the concentration of New York ELL test-taking students in New York City public schools, New York appears to have the greatest degree of isolation of ELL test-takers among the five large ELL states. More than 90% of New York fourth-grade ELL students who took proficiency tests were in schools that reported math test scores for ELL students. In comparison, the New York ELL reporting schools educated just 19% of fourth-grade white test-takers.
Middle school ELL students who took proficiency assessment tests were also highly concentrated in middle schools that report ELL scores. For example, in California nearly all seventh-grade ELL test-takers were in ELL reporting middle schools. In comparison, those schools enrolled 72% of seventh-grade white test-takers.
Though there is more overlap between ELL reporting schools and the schools that largely educate black students than in the case of the schools educating white students, Appendix B Tables B1 and B2 also show that ELL test-takers and black test-takers were not largely educated in the same schools. Again, the 3,398 elementary schools in California that reported ELL student test scores educated about three-quarters of black test-takers but virtually all the ELL test-takers. Relative to the other states, in Florida ELL students and black students tend not to be enrolled in the same set of public schools.


