The mathematics achievement tabulations analyzed in this report are based on the U.S. Department of Education’s National Longitudinal School-Level State Assessment Score Database.12 The NLSLSASD records in uniform fashion the scores on state achievement tests for more than 80,000 public schools (McLaughlin, 2005). The achievement data are for public schools, not individual students. Among the NLSLSASD’s virtues is that public schools are identified by their National Center for Education Statistics school identification number. Using this, one can easily obtain further information on the characteristics of the public school contained in the National Center for Education Statistics’ Common Core of Data (CCD) Public Elementary/Secondary School Universe Survey (for example, school size, student-to-teacher ratio and Title I eligibility). The 2004–05 school year is the latest year available in the NLSLSASD.
The limited data on English language learner achievement in public schools in Illinois precluded including the state in the analysis. Census data indicate that Illinois ranks fifth among states in the size of the public school population that has limited English speaking proficiency. Arizona ranks sixth, and both Arizona and Illinois had about 400,000 Hispanic students enrolled in their public schools in 2004–05 (NCES, 2007b). In the NLSLSASD, 408 Arizona public schools reported results for English language learners in grade 3 mathematics. Only 18 Illinois public schools reported ELL results for grade 3 mathematics. The dearth of Illinois public schools reporting achievement results does not apply to white students. Illinois has more than twice as many white public school students as Arizona, and 1,663 Illinois public schools reported white achievement results for grade 3 mathematics compared with 722 Arizona public schools. Given the size of the limited English speaking population in Illinois, it is surprising how few Illinois public schools report ELL achievement results in the NLSLSASD.
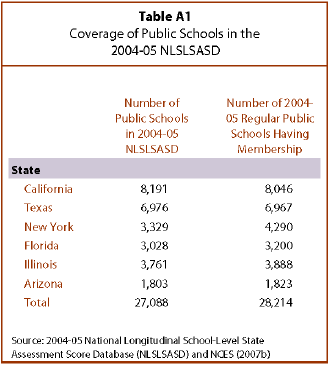
For the five states examined in this report (California, Texas, New York, Florida and Arizona), coverage of public schools in the NLSLSASD approximates the universe of regular public schools according to the National Center for Education Statistics’ Common Core of Data:
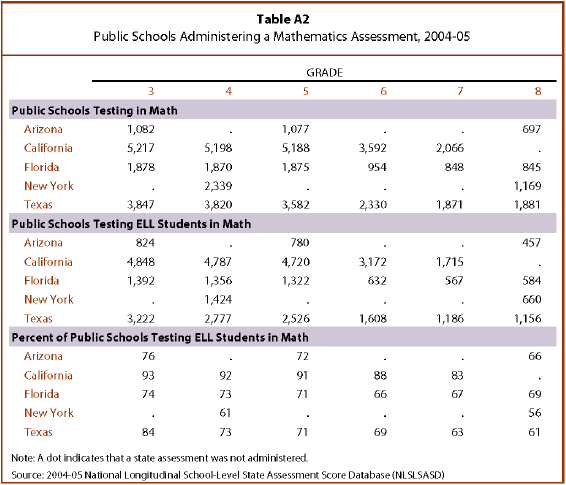
NLSLSASD records the results of a school’s ELL test-takers. Because ELL enrollments by grade and public school are not available in the CCD, it is difficult to gauge the extent to which the number of ELL mathematics test-takers in the NLSLSASD represents the universe of the ELL student population. According to the NLSLSASD, however, most public schools that administered the mathematics assessment in a grade also tested their ELL students:
The fact that a nontrivial proportion of public schools did not test any ELL students might be because some public schools do not have any ELL students enrolled.
While many public schools tested ELL students in mathematics, many of those public schools need not report the results of their ELL test-takers’ performance. Under NCLB, disaggregation of test-taker scores is not required when a subgroup of students is too small to yield statistically reliable information or when the results would reveal information about individual students (Commission on No Child Left Behind, 2007). As a result of the minimum threshold requirements for reporting a group, the number of public schools reporting results for ELL test-takers is less than the number of public schools testing its ELL students:

For example, 5,217 California public schools tested third-grade students in mathematics. Of these, 4,848 tested third-grade ELL students in mathematics and 3,398 had a sufficient number of third grade ELL test-takers to report ELL results for the school. If we want to compare how white test-takers performed in the same public schools, it is important to note that many of the 3,398 public schools reporting ELL performance do not have sufficient numbers of white test-takers to report results for their white test-takers. The number of California public schools that reported both ELL test-taker results and white test-taker results in grade 3 mathematics was 1,775.


