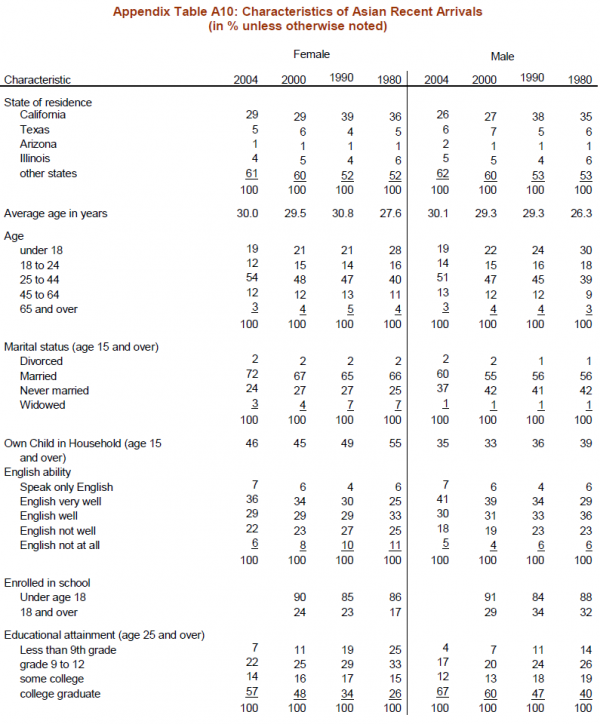
The tabulations presented are from the Decennial Census Integrated Public Use Micro Samples and the 2004 American Community Survey (ACS). The ACS surveys the household population, excluding persons residing in group quarters. To make the Decennial Census figures comparable to the ACS tallies, all the tabulations are restricted to the population residing in households for all years.
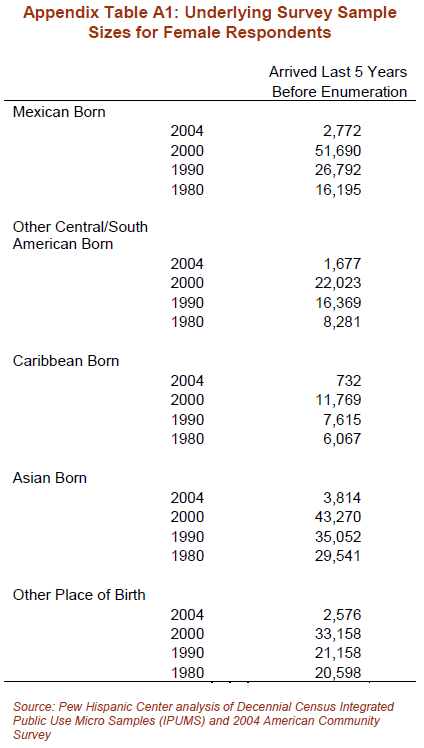
The 2004 ACS surveyed about 483,000 households, roughly 0.4 to 0.5% of all households. The micro samples utilized from the Decennial Censuses are the 5% samples. The underlying unweighted sample sizes for the female immigrants who arrived within five years of the sample enumeration are reported in Table A1.
The survey instrument for the ACS is very similar to the Decennial Census questionnaire. The ACS school enrollment question differs from the Decennial Census and thus the strict comparability between the two sources in regard to school enrollment is uncertain. For this reason, school enrollment tabulations from the ACS are suppressed. The analysis is restricted to individuals born outside the United States and outlying areas and hence persons born in Puerto Rico are not included.
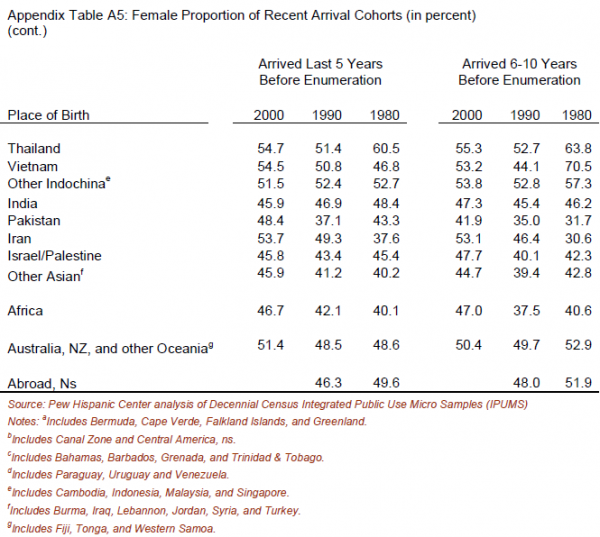
This analysis did not attempt to adjust for Census undercount issues. It is well-known that the Census undercounts undocumented immigrants, an issue particularly relevant for Mexican-born arrivals. The undercount rate of the Mexican foreign-born population is thought to be larger for the 1980 Census than the 2000 Census. Since undocumented Mexican immigrants have been disproportionately male, the 1980 female share of the Mexican arrivals from 1975 to 1980 (45.3% in Table 2) is likely biased upward. Nonetheless, there is not any straightforward, transparent evidence that the arrival flow from Mexico has become more feminine since 1980.