Data Sources
The data in this study are drawn from two types of Census data both including from the long form interview of the decennial U.S. Census, which includes a broad set of demographic measures beyond the basic information most people provide when responding to the Census. The census bureau draws a random sample of 5 percent of these interviews and creates a data set that is then made available to researchers. The Census Summary Files also draw data from the long form however data in these tables reflects results from the full set of responses, rather than a sample of responses. The Census Bureau releases this data as a series of tables at specific geographic levels. For our purposes we used tables summarized at the state and county levels.
County Sample Selection
The goal of the study was to provide a detailed look at the changing settlement patterns of Latinos in the U.S. Inasmuch as the growth in Latino populations in metropolitan areas has been the focus of considerable attention; we broaden our focus here to include smaller communities in locations that formerly had a very small Latino presence. We began focusing on states that had experienced a growth in the Latino population of at least 200 percent. We then eliminated the largest Latino communities, those counties with more than 1 million Latinos in 2000 (we also eliminated the very smallest, those with fewer than 1,000 Latinos, because they collectively account for only a small share of the overall Latino population). In order to ensure that the experiences of small communities were documented as well as those in larger locales, we divided counties into three strata based on the size of the Latino population in 2000 and selected a set of counties from each of these strata.
Using state and county level population data from the Census 1990 and 2000 SF1 files we defined a 36 county sample of new Latino settlements. We first narrowed the range to counties to states where the Hispanic population had at least tripled between 1990 and 2000. Nevada was the only state outside of the South that met these criteria.
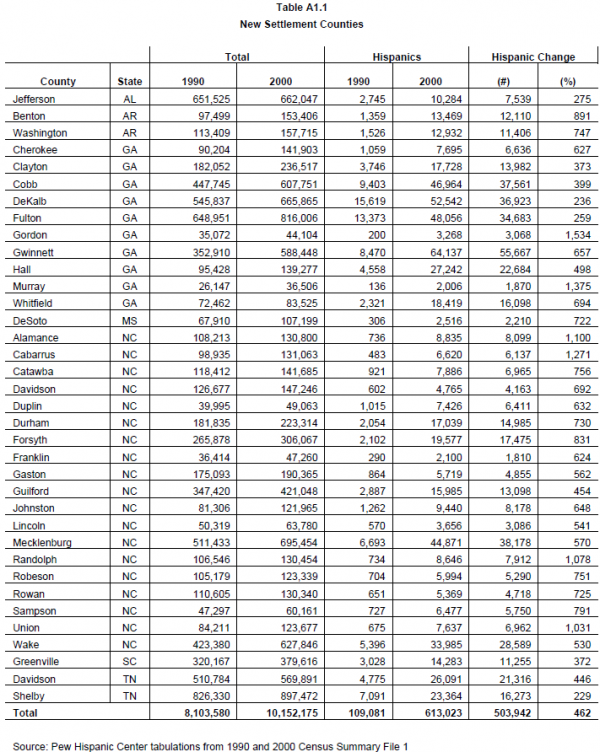
In order to provide a mix of counties—urban, suburban and rural– we divided the remaining counties into three strata. Small counties had 1,000 to 10,000 Latinos in 2000, medium had 10,000 to 100,000, and large had 100,000 or more. We then ranked the counties within each size class by the percent Hispanic population change from 1990 to 2000. We selected the highest ranked 10 percent of these counties in each stratum. Table A1.1 Lists the New Settlement Counties we selected.
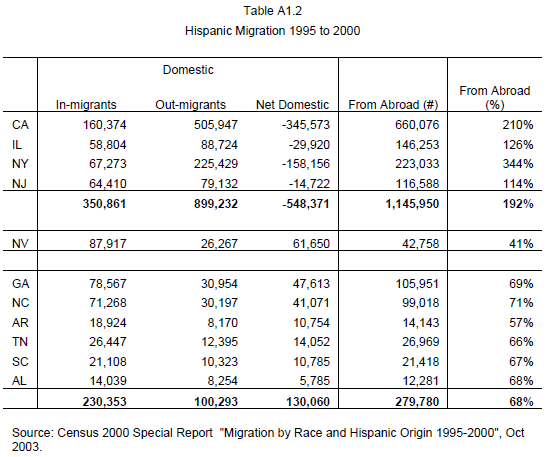
Focusing specifically on six states in the South necessarily limited our county sample, such that rapidly growing Hispanic counties in other parts of the county were excluded from the analysis. For example, among all large counties in the nation, Clark County, Nev., was the only one that both met our state Hispanic growth criteria and ranked in the top ten percent of large counties. We choose to eliminate Clark from our sample of counties and Nevada from our sample of states both because we wanted to focus on a regional phenomenon and because Nevada, to a greater extent than our six southern states received more Hispanic domestic migrants between 1995 and 2000 than international Hispanic migrants. The reverse was true for our six states (Table A1.2).
Among all medium sized counties in the nation, 18 of the 26 highest ranking were in one of the six southern states we choose for our sample. Had we not limited our sample to counties within states which had tripled their Hispanic population, we might have included rapidly growing medium sized counties such as Mohave, Ariz.
Because Public Use Microdata Areas (PUMAs) comprised the smallest, minimum population 100,000, geographic units in the Census 2000 5 percent sample, each county in the sample had to be described using PUMA boundaries. This posed problems for sampling small counties. Universally, large counties had many PUMAs within their boundaries. In these counties, we aggregated PUMAs to represent the county as a whole. Similarly, almost all medium-sized counties either contained several PUMAs or had PUMA boundaries that were the same as the county boundaries. Small counties, however, generally had PUMA boundaries that encompassed more than one county. When PUMA boundaries encompassed more than one county we selected only those county groups in which all the counties within the PUMA ranked in the top 10 percent. Given these limitations we were able to include about 20 percent (17 of the 87 highest-ranking small counties in the nation) of these counties. For example, in North Carolina we grouped Duplin and Sampson Counties because they were within a single PUMA. Whitfield, Gordon and Murray counties were in another PUMA, and Johnston and Franklin in a third. In Georgia, Lincoln and Gaston counties were contained within a single PUMA. Of the 70 small counties we could not include due to PUMA boundary constraints, 43 were within the six southern states in our sample. We excluded 27 counties not in states that had tripled in their Hispanic population over the decade. These counties were primarily in the Midwest and Mountain states. A complete list of excluded counties is available upon request.


