In the future, the growth of the Hispanic population will affect both the payout and revenue sides of the Social Security system. Eventually, when the current stock of young Latinos reaches retirement age, a growing proportion of beneficiaries will be Latino. At the same time, however, the number of Hispanic workers paying into Social Security will more than double as the white baby boom generation moves rapidly from contributor to beneficiary status.
These outcomes result from Hispanics’ demographic characteristics and their different propensity to accumulate wealth and participate in pension plans. The share of retirees who are Hispanic is on the increase. However, Hispanics who will enter retirement in the next 20 years are much less likely to participate in pension plans and have acquired far fewer assets than have whites. Thus, Latino retirees are likely to remain highly dependent on Social Security benefits in the foreseeable future. Conversely, future retirees will be more dependent on Hispanic workers as the number of white workers supporting each retiree steadily declines.
Latinos are a Rising Proportion of Social Security Beneficiaries
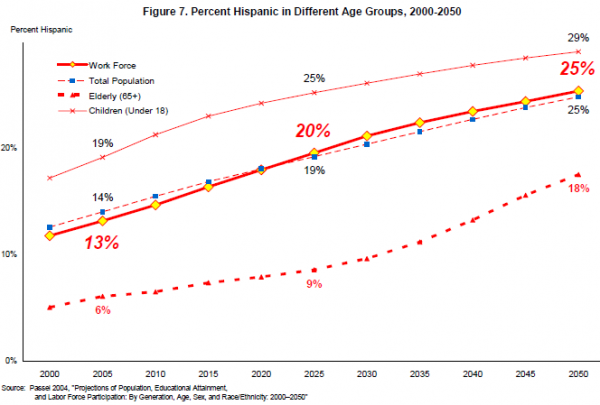
Hispanics are not one of the major groups of older Social Security beneficiaries today. They make up 6 percent of the 65-or-older population today and an even smaller proportion of Social Security beneficiaries.6 This will change over time, however. Hispanics are nearly 17 percent of today’s 18-to-44 year-old population. And with additional immigration, Hispanics are projected to comprise 18 percent of the 65-or-older population by 2050 (Figure 7). The Pew Hispanic Center projects that the number of Hispanics age 65 or older is projected to rise from 2 million in 2004 to 14 million in 2050.
Pension Plan Participation
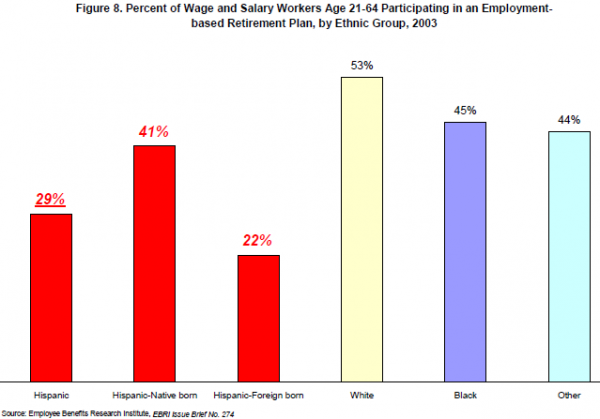
Current indicators suggest that future Hispanic retirees will depend on Social Security to as great an extent as today’s retirees, if not more so. Hispanic workers today are the least likely of all major racial or ethnic groups to participate in an employer-based pension plan (Figure 8). Fewer than 30 percent of Hispanic wage and salary workers participate in a pension plan, in comparison with over half of white wage and salary workers.7 Pension plan participation increases with age, but the fact that Latino workers tend to be younger than white workers does not account for the lower fraction of Hispanics participating in pension plans. Hispanic workers in the same age bracket are less likely to participate in a pension plan than white workers (Copeland, 2004). For example, among workers 25 to 34 years of age, almost half of white workers participate in a pension plan. In comparison, fewer than a quarter of 25-to-34 year-old Hispanic workers are participants in pension plans. The difference partly reflects low participation among foreign-born Hispanic workers, yet only 38 percent of native-born Hispanic workers in that age bracket participate in a pension plan. Similarly, workers who earn more are more likely to participate in a pension plan than lower-paid workers. But the lower earnings of Hispanic workers do not fully account for the pension plan participation differences between whites and Hispanics. Among similarly paid workers, Hispanics are less likely to participate than whites.
Hispanic pension plan participation could increase in the future. But that would be a reversal of previous aggregate trends. Average pension plan participation has fallen for Hispanic workers since 1987, whereas it has risen for white workers (Copeland, 2004).
Wealth Accumulation
Hispanics nearing retirement age are among the least prepared of the principal racial and ethnic groups. Retirement income is usually derived from some combination of three sources – Social Security, pensions and personal wealth. Latino households lag white households in personal wealth and asset ownership by a wide margin. Lacking in personal wealth, Hispanics entering into retirement over the next twenty years, and possibly beyond, will remain more dependent on Social Security than whites.
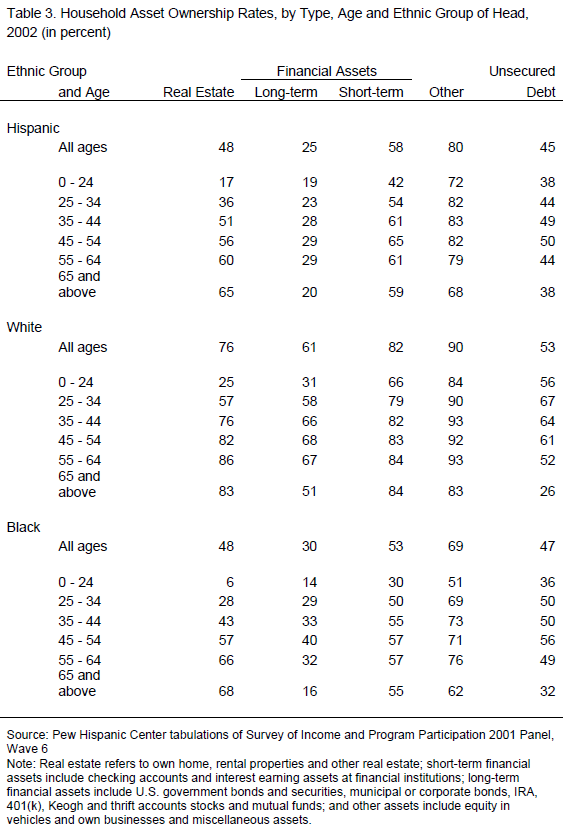
Table 3 shows the rate of asset ownership for Hispanic, white and black households in 2002. Ownership of real estate and long-term financial assets (stocks, bonds, IRAs, etc.) is the most critical element of wealth accumulation from the point of view of retirement. By this measure, most white households nearing retirement have undertaken some preparation. Over 85 percent of white heads of households ages 55 to 64 own a home and over two thirds own long-term financial assets. About the same can be said for white heads of household in the 45-to-54 age bracket. Hispanic households are far behind. Only 60 percent of Latino heads of household ages 55 to 64 own real estate and fewer than 30 percent possess long-term financial assets. In fact, there is no age group in which more than 30 percent of Hispanic households own long-term financial assets. Financial market participation among Hispanics lags far behind that of whites, and this lack of engagement with the financial markets raises questions about whether the Latino population is well-positioned to take advantage of the potential gains from the privatization of Social Security.
Latinos who do own assets have accumulated far less value in those assets than have whites. Hispanic homeowners between the ages of 45 and 64 have a median equity of about $66,000 in real estate (Table 4). White homeowners, more numerous than Latinos, have much higher equity. In the age bracket of 55 to 64, white homeowners possess a median equity value of $116,713, and those ages 45 to 54 have $83,359 in home equity. A similar disparity emerges with respect to owners of long-term financial assets. White heads of household ages 45 to 64 have at least twice as much value as Hispanic heads of household in these financial holdings. For example, white heads of household ages 45 to 54 owned $40,088 in long-term financial assets compared with only $19,326 for Hispanic heads of households. In sum, not only are Latinos less likely to own assets, those who do have amassed far less wealth than whites.
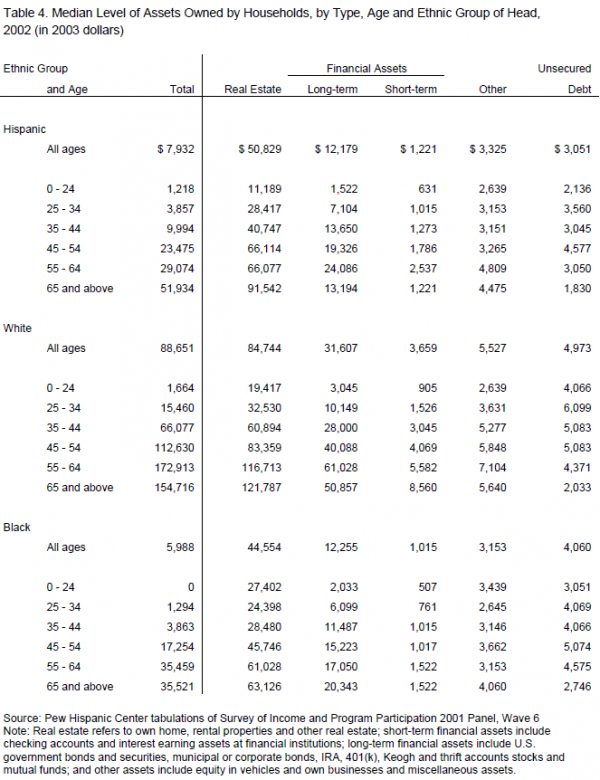
The picture turns much bleaker when all Latino households, not just those that own assets, are compared with all white households. The median wealth of all Hispanic households where the head was 65 or older was $51,934 in 2002 (Table 4). That was only one third as high as the median wealth – $154,716 – of comparable white households. The situation was even worse among those aged 55 to 64. With retirement imminent within a decade, the median wealth of these Latino households was only $29,074, less than one fifth the median wealth of white households in the same age bracket. The situation was not much better among Hispanic households in the 45-to-54 age bracket. The median wealth among Hispanics there was $23,475, one fifth as high as the median wealth of $112,630 among white households in the same age bracket. The low level of wealth accumulation among Latinos reaching retirement age within the next 20 years ensures that Social Security will remain the predominant source of their income following retirement.
Latinos are Growing Contributors to the Social Security Tax Base
Hispanics are a young and growing population. More than one in three of the nation’s 40 million Hispanics are under age 18 (Figure 1). And Hispanics will account for much of the growth in the labor force to 2050; in fact, the Hispanic labor force will more than double while the white labor force shrinks. Under a pay-as-you-go financing structure such as Social Security has traditionally employed, it is the increasing numbers of Hispanic workers who will support the additional retirees as the nation ages.
Demographic change over the last 30 years has greatly increased the presence of Latinos in the U.S. work force and population. Continued immigration (even at somewhat reduced levels) and slightly higher than average fertility will lead to even further growth in the presence of Hispanics in the U.S. population and labor force. In 2005, Hispanics account for about 14 percent of the U.S. population and 13 percent of the labor force. By 2050, both figures will roughly double to the point where Hispanics will represent one quarter of the total population and labor force (Figure 7).
It is the absolute growth in the Hispanic work force that truly brings home the growing role of Latinos in the U.S. economy and the financing of Social Security. Between 2005 and 2050, the U.S. labor force is projected to grow by about 39 million, or more than one quarter, from 143 million to 182 million.8 During this time, the Hispanic labor force is projected to grow by 27 million, from about 19 million in 2005 to 46 million in 2050 (Figure 9). This growth is far larger than the 7 million growth projected for blacks and the 11 million growth projected for the Asian-Pacific Islander population. Further, the critical importance of the growth of the Hispanic labor force is highlighted by the slight decline in the size of the white labor force projected over this period from about 100 million to 94 million. In other words, most of the labor force growth in the next 45 years will come from the Latino population at a time when the number of elderly people in the United States will be increasing substantially from 35 million to 77 million (not shown separately).

Another view of the role of Hispanics in support of Social Security is given by the ratio of workers to retirees. The decrease in this ratio is at the heart of the Social Security financing problems, as fewer workers are paying taxes to support each retiree.9 In 2005, there are about 4.1 workers per elderly person. About 13 percent of these are Latinos meaning that there are about 0.55 Latino workers per elderly person (Figure 10).
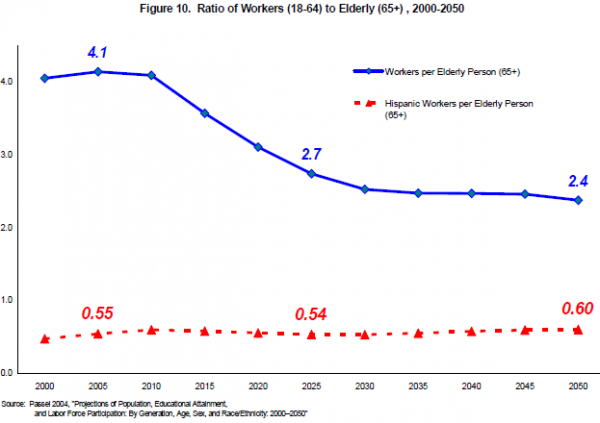
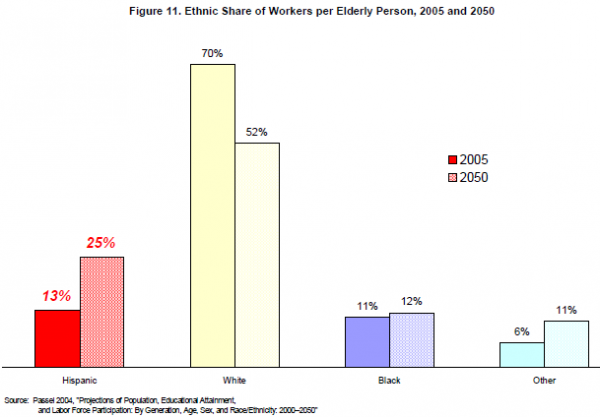
The overall ratio begins to decline sharply after about 2012 and then levels out after about 2035, reaching just 2.4 workers per elderly person in 2050. Over the entire period, however, the ratio of Hispanic workers per elderly person remains slightly higher than its initial value, and by 2050 it is 0.60. The lack of change in the ratio of Hispanic workers per elderly person means that the Hispanic work force is increasing at roughly the same rate as the elderly population – and both are growing rapidly. Were this true of the total population, Social Security would not be facing financing problems. The overall ratio is declining because the number of white workers is falling while the elderly population increases. The number of Hispanic workers supporting the growing elderly population is increasing. The Hispanic labor force more than doubles in size over the period and the Hispanic share of the workers per elderly person nearly doubles from 13 percent in 2005 to 25 percent in 2050 (Figure 11). In short, a growing Hispanic work force will be supporting a growing population 65 and over so long as Social Security retains its current financing structure in which today’s workers fund the retirement benefits of the current recipients.