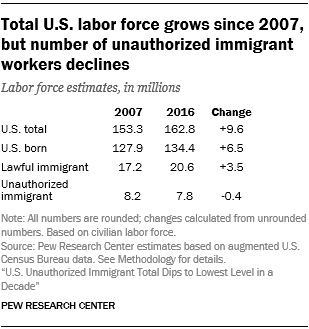
A total of 7.8 million unauthorized immigrants ages 18 and older were in the labor force in 2016 – the first time since 2006 that the number working or looking for work has declined significantly below 8 million. The decline was driven by a decreased number of unauthorized immigrant men in the labor force – about 5.0 million in 2016, compared with 5.6 million in 2007. The number of women in the labor force grew, to 2.8 million from 2.6 million.
During the same period, the overall U.S. workforce grew, as did the number of U.S.-born workers and lawful immigrant workers.
Unauthorized immigrants were 4.8% of the nation’s workforce in 2016, a dip from their peak of 5.4% in 2007. Over a more recent time span, both the number and share of unauthorized immigrants in the workforce also were down modestly from 2014.
Unauthorized immigrant men are more likely than U.S.-born men to be in the labor force. Among those ages 18 to 64, 91% of unauthorized immigrant men and 79% of U.S.-born men were in the workforce in 2016. Most of the difference is because higher shares of U.S.-born men are in school, disabled or retired, according to a Pew Research Center analysis of census data. The labor force participation rate for unauthorized immigrant men in this age group has changed little since 2007, while ticking down for the U.S. born.
Among women ages 18 to 64, unauthorized immigrants are less likely to be in the labor force – 61% were in 2016, compared with 73% of the U.S. born. Here, the difference mainly is because unauthorized immigrant women are more likely to have young children at home, according to other census data analyzed by Pew Research Center. Compared with 2007, labor force participation rates were slightly higher in 2016 for both U.S.-born and unauthorized immigrant women.
Agriculture is the job category with the highest share of unauthorized immigrants
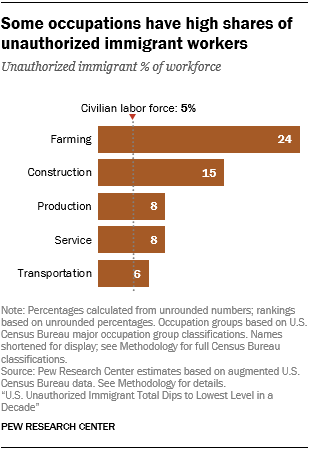
Unauthorized immigrants are nearly a quarter of the workforce in farming, fishing and forestry occupations in 2016, which mainly consist of agriculture work. That represents a decline since 2007, but this category is still where unauthorized immigrants are most overrepresented. These occupations also have the highest share of unauthorized immigrants in at least 26 states.
Unauthorized immigrants constitute 15% of construction workers, about triple their share of the overall workforce. In 14 states, construction is the occupation category with the largest share of unauthorized immigrants in the workforce.
In both farming and construction occupations, U.S.-born workers make up the majority of the workforce, unauthorized immigrants the next largest group and lawful immigrants the smallest. In all other major occupational categories, unauthorized immigrants are the smallest segment of the workforce, after the U.S. born and lawful immigrants. U.S.-born workers are a majority in all major occupational groups.
Occupation and industry: What’s the difference?
This report includes estimates about the occupations and industries in which unauthorized immigrants work. Occupation is the kind of work that people do on the job, while industry is the kind of business conducted by an employer.
Some occupation groups are similar to industry categories. For example, many construction workers are employed in the construction industry. But the construction industry also employs people in other occupations, such as manager or clerk.
The U.S. Census Bureau collects data on occupation and industry from responses to write-in and check-box questions. The responses are then coded using a standard classification system.
Unauthorized immigrants also hold a disproportionate share of service, transportation and production occupations – that is, a larger share than their overall 5% share of the workforce. (Production jobs include manufacturing, food processing and textile occupations.)
Service jobs employ the largest number of unauthorized immigrants – 2.4 million in 2016. They also are the largest occupation in at least 40 states.
But unauthorized immigrants are underrepresented in some white-collar occupations. They make up 2% or less of the workforce in management, professional and office occupations.
In both the jobs they hold and the industries in which they work, unauthorized immigrants tend to cluster in low-skilled employment, due at least in part to their below-average education levels and lack of legal status to work. Within the most detailed occupational categories, for example, they constitute about 10% or more of about two dozen job types that mainly are in food preparation, construction, and maintenance or cleaning. Unauthorized immigrants, who are one-in-twenty workers overall, account for about one-in-four roofers, drywall installers, carpet installers and painters (see detailed table in Appendix C).
However, all sectors and occupations of the civilian labor force have more U.S.-born workers than unauthorized immigrant workers.
Unauthorized immigrants are overrepresented in some industries
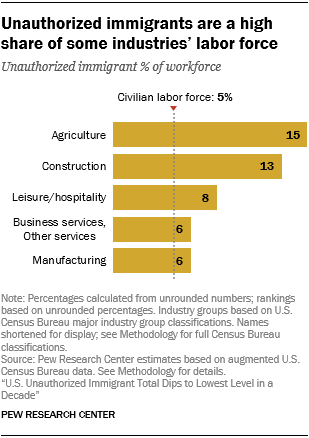
Unauthorized immigrants constitute a larger share of the civilian workforce in some industries than their 5% share of the total workforce. In 2016, they accounted for 15% of workers in the agriculture industry and 13% in construction. Those also were the top industries in the largest number of states. Agriculture ranked first in 19 states, most of them in the West and Midwest, as the industry with the largest share of unauthorized immigrants in its workforce. Construction ranked first in 18 states, about two-thirds of them in the South.
Unauthorized immigrant workers also were overrepresented in the labor force in the leisure and hospitality industry, in some services and in manufacturing.
Looked at from another perspective, those industries also employed a higher share of all unauthorized workers than of all U.S.-born workers. For example, the construction industry employed 18% of unauthorized immigrant workers but only 6% of all U.S.-born workers.
Although there are fewer unauthorized workers overall than in 2007, the number has grown in some industries. In professional and business services, as well as educational and health services, the number of unauthorized immigrant workers grew about 13% (to about 1.6 million combined), and the share of all unauthorized immigrant workers employed in those industries also rose in 2016.


