The overall percentage of lawful immigrants to the United States choosing to apply for and gaining citizenship is at its highest level in more than two decades. Yet in terms of naturalization rate, Mexicans – the single largest group of lawful immigrants by country of origin – lag well behind green-card holders eligible to apply from other parts of the globe.
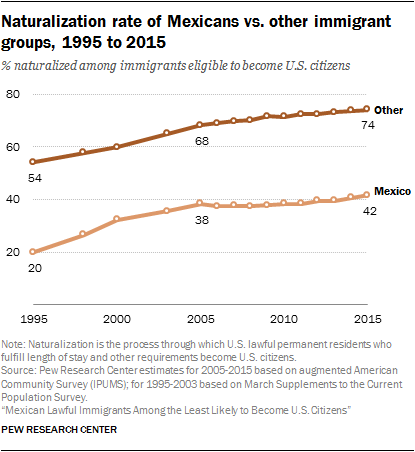
Based on Pew Research Center estimates using the most recent U.S. Census Bureau data available, two-thirds (67%) of lawful immigrants eligible to apply for U.S. citizenship had applied for and obtained citizenship by 2015. This is the highest share since at least the mid-1990s. But among Mexican lawful immigrants eligible to apply, only 42% had applied for and obtained U.S. citizenship by 2015, a rate little changed since 2005 and one of the lowest among all immigrant groups when it comes to country of origin.
Naturalization rate
The number of naturalized immigrants divided by the number of naturalized immigrants plus the number of lawful immigrants who are eligible to apply for naturalization in a given year.
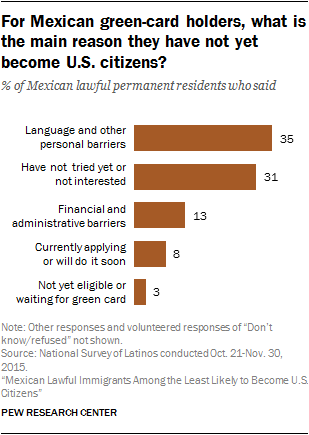
As part of a larger survey of Hispanic immigrants fielded in late 2015, Pew Research Center asked Mexican green-card holders why they had not yet become naturalized U.S. citizens. The most frequent reasons centered on inadequate English skills, lack of time or initiative, and the cost of the U.S. citizenship application. These appear to be significant barriers, as nearly all lawful immigrants from Mexico said they would like to become U.S. citizens someday.
Overall, 11.9 million of the nation’s 45 million immigrants in 2015 held lawful permanent residence (LPR) status – that is, they held “green cards,” according to Pew Research Center estimates. Of this number, most (9.3 million) had met the eligibility requirements – including length of residence – to apply for U.S. citizenship in 2015.1 Mexicans made up 37% of this group and constituted the single largest group of green-card holders without U.S. citizenship by country of origin.2
In the United States, the citizenship, or naturalization, rate among all lawful immigrants steadily increased from 1995 to 2005, rising from 47% to 62%. Until about 2005, the naturalization rate among lawful immigrants from Mexico also increased steadily, but did so more rapidly (from 20% in 1995 to 38% in 2005), narrowing the gap between Mexicans and other immigrants. However, between 2005 and 2010, the naturalization rate of Mexican green-card holders leveled off, even as the rate for lawful permanent residents from other parts of the globe continued to rise. Only in the period from 2011 to 2015 did the rate of naturalization among eligible Mexican immigrants significantly increase again at a pace higher than that of other lawful U.S. immigrants – going from 38% to 42% among Mexicans, compared with a 2-percentage-point increase, from 72% to 74% among non-Mexican immigrants.
As of 2015, the naturalization rate for lawful Mexican immigrants trailed that of green-card holders from the Middle East by 42 percentage points (42% vs. 83%), and was 33 points behind green-card holders from Africa, 74% of whom had naturalized by 2015. Middle Eastern immigrants had the highest naturalization rate among all immigrant origin groups, while African immigrants saw the highest increase in naturalization rate in the last decade.
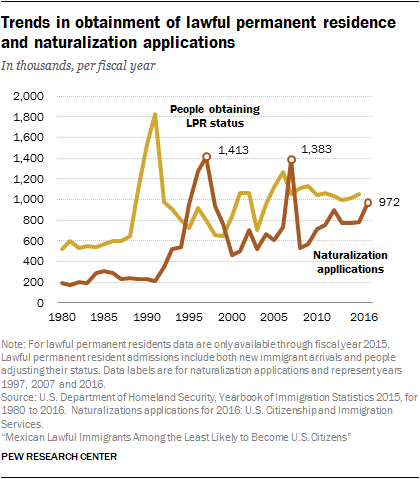
Early signs are that 2017 could see an increase in the rate of naturalization of lawful permanent residents. According to the latest figures released by the U.S. Department of Homeland Security’s Citizenship and Immigration Services, there were 525,000 naturalization applications submitted during the first half of fiscal year 2017, which started Oct. 1.3 That number is up 21% from the 435,000 applications submitted in the same period of 2016, which already had seen a spike on naturalization applications compared with previous years. The total applications for fiscal 2016 were up by 24% compared with 2015, and represented the highest number of applications for naturalization since 2008. Meanwhile, the number of lawful permanent residents admitted since 2010, many of whom would have recently become eligible to apply for citizenship, has stabilized at around 1 million per year since 2010.
Even so, the volume of citizenship applications in 2017 and 2016 still pales in comparison to the record levels seen in 1997 (1.41 million applications) and 2007 (1.38 million).These spikes were triggered in large part by congressional legislation passed a decade earlier that provided a path to lawful permanent residence and eventual citizenship for many unauthorized immigrants.4 The spike in 2007 occurred ahead of an increase in the citizenship application fee for adults, which rose from $330 to $595 on July 30, 2007.
Some have posited that fiscal 2016’s growth in applications and the more recent spike during the first quarter of fiscal 2017 (right after the election) are attributable to anti-immigrant rhetoric associated with 2016 U.S. presidential election. There is also evidence that some organizations worked to help lawful immigrants submit naturalization applications during the campaign.5 But at least some immigrants may have applied to avoid a further $45 increase in the citizenship application fee that was scheduled to go into effect Dec. 23, 2016. That increase, which raised the total application fee to $640 per adult, was officially announced in May 2016.
Naturalization rates among Mexican and other Latino immigrants
In 2015, half (52%) of all Latino lawful immigrants (mainly originating from Mexico, as well as Central and South America) eligible to become U.S. citizens had in fact naturalized. Among this group, Mexicans had a naturalization rate of 42%, compared with 64% among lawful immigrants from other countries in Latin America.
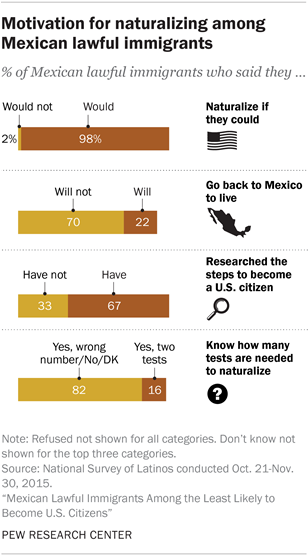
In its 2015 survey of Latino immigrants, Pew Research Center found that among lawful Mexican immigrants and other Latino immigrants, the desire to become U.S. citizens was high. Nearly all (98%) Mexican lawful immigrants and 94% of other lawful Latino immigrants said they would naturalize if they could.
The survey also found that about two-thirds (67%) of Mexican lawful permanent residents said they had investigated the citizenship application process, compared with 80% of non-Mexican Latino lawful permanent residents. And a large majority of Mexican and other Latino lawful permanent residents (70% and 66% respectively) said they planned to stay in the U.S. and not return to their home country later in life, one reason some of them might seek U.S. citizenship.
Despite their wish to naturalize, many Latino lawful immigrants were not familiar with details of the process. Just 16% of Mexican and 21% of other Latino lawful immigrants correctly answered that two tests are part of the U.S. naturalization process.
It is not only Latino lawful permanent resident immigrants who want to become U.S. citizens: In the 2015 survey, Latino immigrants who did not have a green card and were not eligible to naturalize (a group likely in the country without authorization) also wanted to become U.S. citizens.6 According to the survey, fully 91% in this group said they would naturalize if they could, and about one-third (32%) had done some research into the steps needed to become a U.S. citizen, though only 5% knew they need to take two tests to naturalize.
Mexican and non-Mexican Latino lawful immigrants face somewhat similar barriers to citizenship
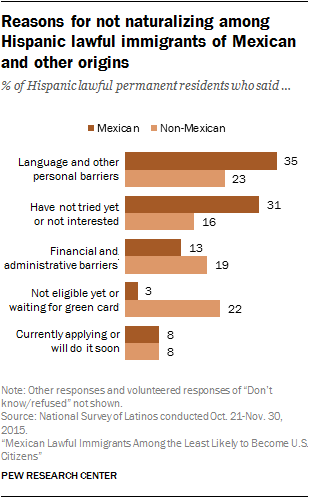
Asked why they hadn’t yet naturalized, the Center’s 2015 survey found that 35% of Mexican and 23% of other Latino immigrants with green cards identified personal barriers, such as a lack of English proficiency. Another common reason given was a lack of interest or just having not applied yet. About a third (31%) of Mexican lawful immigrants said this, while only 16% of non-Mexican Latino immigrants said the same. An additional 13% of Mexican and 19% of non-Mexican lawful immigrants identified financial and administrative barriers, mainly the cost of naturalization.
This report is based on three data sources. Data on naturalization trends among lawful immigrants are based on Pew Research Center estimates based on the U.S. Census Bureau’s American Community Survey (ACS) and Current Population Survey (CPS). The ACS is a year-round survey of 3.5 million households conducted by the U.S. Census Bureau. The CPS is a monthly survey of about 55,000 households conducted jointly by the U.S. Bureau of Labor Statistics and the Census Bureau. Each March, the CPS is expanded to produce additional data on the nation’s foreign-born population and other topics. Legal status of immigrants in the ACS and CPS is inferred based on methods described in the Center’s research on unauthorized immigrants in the U.S.
Latino immigrant attitudes about naturalization come from a nationally representative bilingual telephone survey of 1,500 Latino adults, including 795 immigrants. The survey was conducted between Oct. 21 and Nov. 30, 2015. The margin of error for the full sample is plus or minus 3.3 percentage points at the 95% confidence level; for foreign-born Latinos, the margin of error is plus or minus 4.4 percentage points. For a full description of the survey methodology, see the Methodology section at the end of the report.
U.S. Citizenship Eligibility
To become a U.S. citizen, a lawful permanent resident in most cases must:
- Be at least 18 years old.
- Have lived in the U.S. continuously for five years.
- Be able to speak, write, read and understand basic English.
- Answer questions that demonstrate knowledge of U.S. government and history.
- Undergo a successful background check.
- Demonstrate attachment to the principles of the U.S. Constitution.
- Take the oath of citizenship swearing allegiance to the U.S.
Some of those requirements are waived for certain groups:
- Spouses of U.S. citizens can naturalize after three years of continuous residence, if the sponsoring spouse has been a U.S. citizen for all three years.
- Foreign-born minor children become citizens when their parents naturalize.
- Foreign-born minor children who are adopted by U.S. citizens are eligible for citizenship upon their arrival in the U.S.
- Military personnel, their spouses and foreign-born minor children are eligible for expedited and overseas citizenship processing with the possibility of having some of the eligibility requirements diminished or waived. Additionally, in the case of death as result of combat while serving in active duty, citizenship may be granted posthumously to the military member and immediate family members.
The filing fees of processing a citizenship request for all applicants were $680 at the time of the Center’s survey in 2015. This included a $595 filing fee and an $85 biometric services fee for processing fingerprints. Starting Dec. 23, 2016, the citizenship application fee rose by $45.
The filing fee could be waived for applicants with family incomes below 150% of the poverty line, if they, their spouse or head of household receives a means-tested benefit, or if the applicant is experiencing a financial hardship that prevents them from paying the fee (such as unexpected medical bills). Starting Dec. 23, 2016 there is also a reduced filing fee of $320 available for naturalization applicants with family incomes between 150% and 200% the poverty line.
The terms “Latino” and “Hispanic” are used interchangeably in this report.
“Foreign born” refers to people born outside of the United States, Puerto Rico or other U.S. territories to parents who were not U.S. citizens.
The following terms are used to describe immigrants and their status in the U.S. In some cases, they differ from official government definitions because of limitations in the available survey data.
- Lawful immigrant population: Naturalized citizens, people granted lawful permanent residence (previously known as legal permanent residence), those granted asylum, people admitted as refugees and people admitted under a set of specific authorized temporary statuses for longer-term residence and work.
- Lawful permanent resident (LPR), lawful permanent resident alien, authorized migrant, or green-card holder: A citizen of another country who has been granted a visa that allows work and permanent residence in the U.S. For this analysis, lawful permanent residents include those admitted as refugees or granted asylum.
- Naturalized citizen: Lawful permanent resident who has fulfilled the length of stay and other requirements to become a U.S. citizen and who has taken the oath of citizenship.
- Unauthorized migrant: Citizen of another country who lives in the U.S. without a currently valid visa.
- Eligible immigrant: In this report, a lawful permanent resident who is 18 years of age or older and meets the length of stay qualifications to file a petition to become a citizen but has not yet naturalized.
- Lawful temporary migrant: A citizen of another country who has been granted temporary residence in the U.S. with a temporary visa that may or may not allow them to work.


