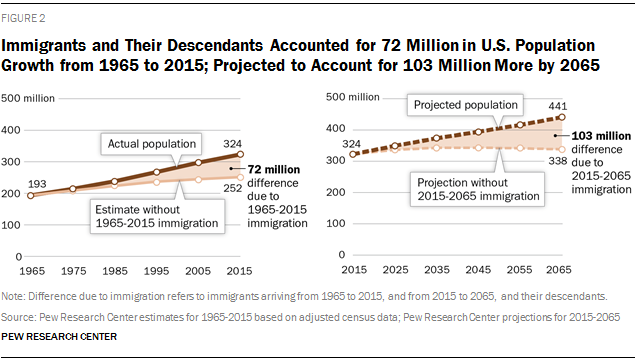
Looking ahead, new Pew Research Center U.S. population projections show that if current demographic trends continue, future immigrants and their descendants will be an even bigger source of population growth. Between 2015 and 2065, they are projected to account for 88% of the U.S. population increase, or 103 million people, as the nation grows to 441 million.
These are some key findings of a new Pew Research analysis of U.S. Census Bureau data and new Pew Research U.S. population projections through 2065, which provide a 100-year look at immigration’s impact on population growth and on racial and ethnic change. In addition, this report uses newly released Pew Research survey data to examine U.S. public attitudes toward immigration, and it employs census data to analyze changes in the characteristics of recently arrived immigrants and paint a statistical portrait of the historical and 2013 foreign-born populations.
Post-1965 Immigration Drives U.S. Population Growth Through 2065
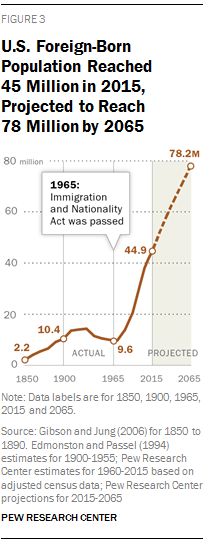
Immigration since 1965 has swelled the nation’s foreign-born population from 9.6 million then to a record 45 million in 2015.1 (The current immigrant population is lower than the 59 million total who arrived since 1965 because of deaths and departures from the U.S.)2 By 2065, the U.S. will have 78 million immigrants, according to the new Pew Research population projections.
The nation’s immigrant population increased sharply from 1970 to 2000, though the rate of growth has slowed since then. Still, the U.S. has—by far—the world’s largest immigrant population, holding about one-in-five of the world’s immigrants (Connor, Cohn and Gonzalez-Barrera, 2013).
Between 1965 and 2015, new immigrants, their children and their grandchildren accounted for 55% of U.S. population growth. They added 72 million people to the nation’s population as it grew from 193 million in 1965 to 324 million in 2015.
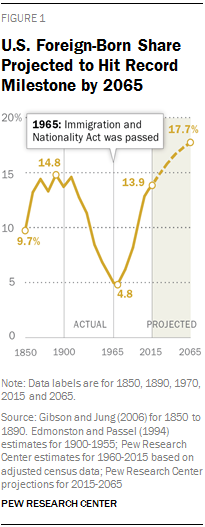
This fast-growing immigrant population also has driven the share of the U.S. population that is foreign born from 5% in 1965 to 14% today and will push it to a projected record 18% in 2065. Already, today’s 14% foreign-born share is a near historic record for the U.S., just slightly below the 15% levels seen shortly after the turn of the 20th century. The combined population share of immigrants and their U.S.-born children, 26% today, is projected to rise to 36% in 2065, at least equaling previous peak levels at the turn of the 20th century.
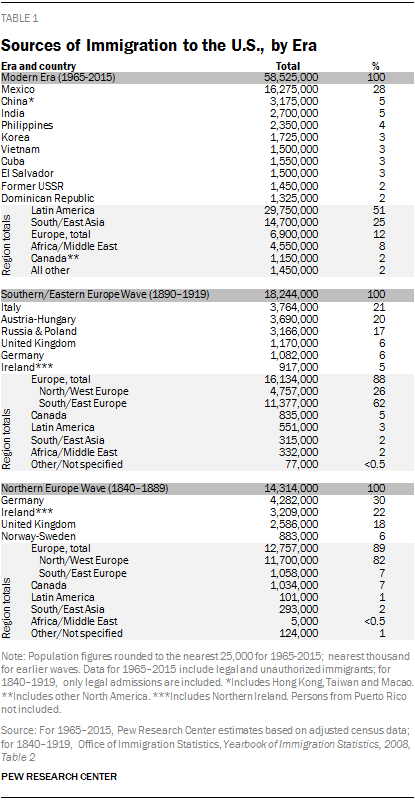
The 1965 Immigration and Nationality Act made significant changes to U.S. immigration policy by sweeping away a long-standing national origins quota system that favored immigrants from Europe and replacing it with one that emphasized family reunification and skilled immigrants. At the time, relatively few anticipated the size or demographic impact of the post-1965 immigration flow (Gjelten, 2015). In absolute numbers, the roughly 59 million immigrants who arrived in the U.S. between 1965 and 2015 exceed those who arrived in the great waves of European-dominated immigration during the 19th and early 20th centuries. Between 1840 and 1889, 14.3 million immigrants came to the U.S., and between 1890 and 1919, an additional 18.2 million arrived (see Table 1 for details).
After the replacement of the nation’s European-focused origin quota system, greater numbers of immigrants from other parts of the world began to come to the U.S. Among immigrants who have arrived since 1965, half (51%) are from Latin America and one-quarter are from Asia. By comparison, both of the U.S. immigration waves in the mid-19th century and early 20th century consisted almost entirely of European immigrants.
Latin American and Asian Immigration Since 1965 Changes U.S. Racial and Ethnic Makeup
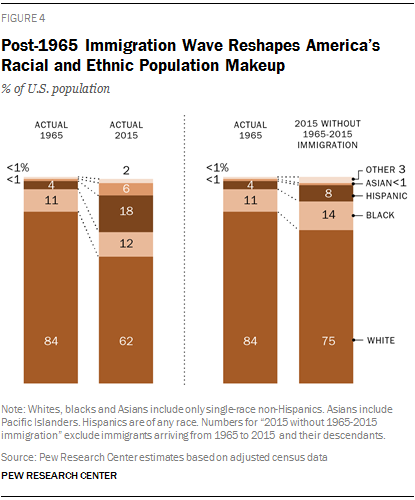
As a result of its changed makeup and rapid growth, new immigration since 1965 has altered the nation’s racial and ethnic composition. In 1965, 84% of Americans were non-Hispanic whites. By 2015, that share had declined to 62%. Meanwhile, the Hispanic share of the U.S. population rose from 4% in 1965 to 18% in 2015. Asians also saw their share rise, from less than 1% in 1965 to 6% in 2015.
The Pew Research analysis shows that without any post-1965 immigration, the nation’s racial and ethnic composition would be very different today: 75% white, 14% black, 8% Hispanic and less than 1% Asian.
The arrival of so many immigrants slightly reduced the nation’s median age, the age at which half the population is older and half is younger. The U.S. population’s median age in 1965 was 28 years, rising to 38 years in 2015 and a projected 42 years in 2065. Without immigration since 1965, the nation’s median age would have been slightly older—41 years in 2015; without immigration from 2015 to 2065, it would be a projected 45 years.
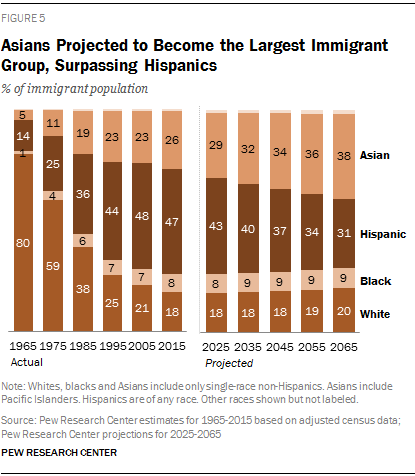
By 2065, the composition of the nation’s immigrant population will change again, according to Pew Research projections. In 2015, 47% of immigrants residing in the U.S. are Hispanic, but as immigration from Latin America, especially Mexico (Passel, Cohn and Gonzalez-Barrera, 2012), has slowed in recent years, the share of the foreign born who are Hispanic is expected to fall to 31% by 2065. Meanwhile, Asian immigrants are projected to make up a larger share of all immigrants, becoming the largest immigrant group by 2055 and making up 38% of the foreign-born population by 2065. (Hispanics will remain a larger share of the nation’s overall population.) Pew Research projections also show that black immigrants and white immigrants together will become a slightly larger share of the nation’s immigrants by 2065 than in 2015 (29% vs. 26%).
The country’s overall population will feel the impact of these shifts. Non-Hispanic whites are projected to become less than half of the U.S. population by 2055 and 46% by 2065. No racial or ethnic group will constitute a majority of the U.S. population. Meanwhile, Hispanics will see their population share rise to 24% by 2065 from 18% today, while Asians will see their share rise to 14% by 2065 from 6% today.
From Ireland to Germany to Italy to Mexico: Where Each State’s Largest Immigrant Group Was Born, 1850 to 2013
The United States has long been—and continues to be—a key destination for the world’s immigrants. Over the decades, immigrants from different parts of the world arrived in the U.S. and settled in different states and cities. This led to the rise of immigrant communities in many parts of the U.S.
The nation’s first great influx of immigrants came from Northern and Western Europe. In 1850, the Irish were the largest immigrant group nationally and in most East Coast and Southern states. By the 1880s, Germans were the nation’s largest immigrant group in many Midwestern and Southern states. At the same time, changes to U.S. immigration policy had a great impact on the source countries of immigrants. In 1880, Chinese immigrants were the largest foreign-born group in California, Oregon, Washington, Idaho and Nevada. But with the Chinese Exclusion Act of 1882, Chinese immigrants were prevented from entering the U.S. As a result, other immigrant groups rose to become the largest in those states.
By the early 20th century, a new wave of immigration was underway, with a majority coming from Southern Europe and Eastern Europe. By the 1930s, Italians were the largest immigrant group in the nation and in nine states, including New York, Louisiana, New Jersey and Nevada.
The composition of immigrants changed again in the post-1965 immigration era. By the 1980s, Mexicans became the nation’s largest immigrant group; by 2013, they were the largest immigrant group in 33 states. But other immigrant groups are represented as well. Chinese immigrants are the largest immigrant group in Massachusetts and Pennsylvania. Indians are the largest immigrant group in New Jersey. Filipinos are the largest immigrant group in Alaska and Hawaii.
For more, explore our decade-by-decade interactive map feature.
For the U.S. Public, Views of Immigrants and Their Impact on U.S. Society Are Mixed
For its part, the American public has mixed views on the impact immigrants have had on American society, according to a newly released Pew Research Center public opinion survey. Overall, 45% of Americans say immigrants in the U.S. are making American society better in the long run, while 37% say they are making it worse (16% say immigrants are not having much effect). The same survey finds that half of Americans want to see immigration to the U.S. reduced (49%), and eight-in-ten (82%) say the U.S. immigration system either needs major changes or it needs to be completely rebuilt.
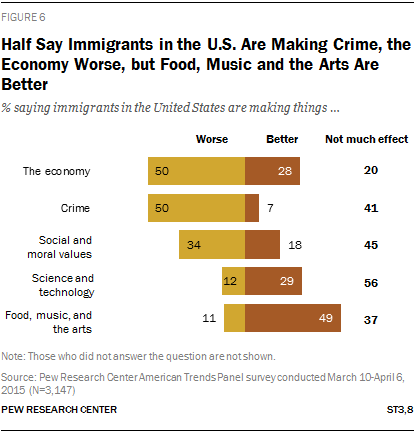
The public’s views of immigrants’ impact on the U.S. vary across different aspects of American life. Views are most negative about the economy and crime: Half of U.S. adults say immigrants are making things worse in those areas. On the economy, 28% say immigrants are making things better, while 20% say they are not having much of an effect. On crime, by contrast, just 7% say immigrants are making things better, while 41% generally see no positive or negative impact of immigrants in the U.S. on crime.
On other aspects of U.S. life, Americans are more likely to hold neutral views of the impact of immigrants. Some 45% say immigrants are not having much effect on social and moral values, and 56% say they are not having much effect on science and technology. But when it comes to food, music and the arts, about half (49%) of adults say immigrants are making things better.
U.S. adults’ views on the impact of immigrants on American society also differ depending on where immigrants are from. Some 47% of U.S. adults say immigrants from Asia have had a mostly positive impact on American society, and 44% say the same about immigrants from Europe. Meanwhile, half of Americans say the impact of immigrants from Africa has been neither positive nor negative.
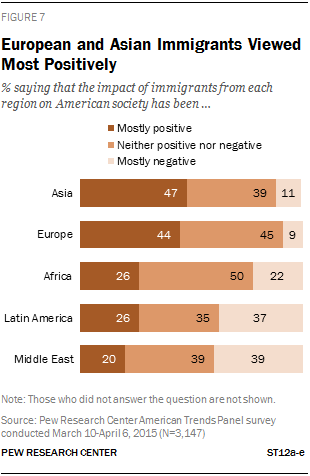
However, Americans are more likely to hold negative views about the impact of immigrants from Latin America and the Middle East. In the case of Latin American immigrants, 37% of American adults say their impact on American society has been mostly negative, 35% say their impact is neither positive nor negative, and just 26% say their impact on American society has been positive. For immigrants from the Middle East, views are similar—39% of U.S. adults say their impact on American society has been mostly negative, 39% say their impact has been neither positive nor negative, and just 20% say their impact has been mostly positive on U.S. society.
Many Americans say that immigrants to the U.S. are not assimilating. Two-thirds of adults say immigrants in the U.S. today generally want to hold on to their home country customs and way of life, while only about a third (32%) say immigrants want to adopt Americans customs. The survey also finds that 59% of Americans say most recent immigrants do not learn English within a reasonable amount of time, while 39% say they do.
The nationally representative bilingual survey of 3,147 adults was conducted online using the Pew Research Center’s American Trends Panel from March 10 to April 6, 2015, before the current national discussion began about national immigration policy, unauthorized immigration and birthright citizenship. The survey has a margin of error of plus or minus 2.4 percentage points at the 95% confidence level.
The Profile of Today’s Newly Arrived Is Markedly Different than that of New Arrivals in Previous Decades
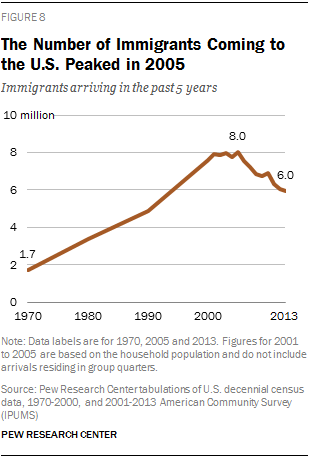
The rewrite of the nation’s immigration policy in 1965 opened the door to new waves of immigrants whose origins and characteristics changed substantially over the ensuing decades. As a result, newly arrived immigrants in 2013 (those who had been in the U.S. for five years or less) differ in key ways from those who were new arrivals in the 1970s, 1980s and 1990s.
Overall, the number of newly arrived immigrants peaked in the early 2000s: Some 8 million residents of other countries came to the U.S. between 2000 and 2005. The number of recent arrivals declined after that, to about 6 million for the years 2008 to 2013, according to a Pew Research Center analysis of federal government data.
Perhaps the most striking change in the profile of newly arrived immigrants is their source region. Asia currently is the largest source region among recently arrived immigrants and has been since 2011.3 Before then, the largest source region since 1990 had been Central and South America, fueled by record levels of Mexican migration that have since slowed. Back in 1970, Europe was the largest region of origin among newly arrived immigrants. One result of slower Mexican immigration is that the share of new arrivals who are Hispanic is at its lowest level in 50 years.
Compared with their counterparts in 1970, newly arrived immigrants in 2013 were better educated but also more likely to be poor. Some 41% of newly arrived immigrants in 2013 had at least a bachelor’s degree. In 1970, that share was just 20%. On poverty, 28% of recent arrivals in 2013 lived in poverty, up from 18% in 1970. In addition, fewer of the newly arrived in 2013 were children than among the newly arrived immigrants in 1970—19% vs. 27%.
[callout align=”alignright”]
Unauthorized Immigration
This report’s estimates and projections of foreign-born residents in the U.S. comprise both legal and unauthorized immigrants. However, the numbers for each status group are not broken out separately except where stated.
In 2014, 11.3 million unauthorized immigrants lived in the U.S., according to the latest preliminary Pew Research estimate (Passel and Cohn, 2015). That estimate is essentially unchanged since 2009, as the number of new U.S. unauthorized immigrants roughly equals the number who voluntarily leave the country, are deported, convert to legal status or (less commonly) die.
According to Pew Research estimates going back to 1990, this population rose rapidly during the 1990s and peaked in 2007. The number of unauthorized immigrants declined during the recession of 2007-2009 before stabilizing. Illegal immigration from Mexico has been the main factor in these changes in the U.S. unauthorized immigrant population, though Mexicans remain by far the largest unauthorized immigrant group.
For more Pew Research analysis of unauthorized immigration, see here.
Roadmap to the Report
The report is organized as follows: Chapter 1 provides an overview of the nation’s immigration legislation, with a focus on key changes since 1965. It is accompanied by an interactive timeline highlighting U.S. immigration legislation since 1790. Chapter 2 explores the impact of post-1965 immigration on the nation’s demographics up to 2015 and provides a look forward at the future impact of immigration with new Pew Research population projections through 2065. Chapter 3 looks at the post-1965 flow of immigrants through the lens of the recently arrived, exploring changes in the group’s origins and other characteristics. Chapter 4 explores the U.S. public’s views of immigration and immigration policy. Chapter 5 provides a statistical portrait of the nation’s immigrants from 1960 to 2013 and is accompanied by an online interactive statistical portrait of the foreign born and an online interactive exploring the top country of origin among immigrants in each state from 1850 to 2013. Appendix A explains the report’s methodology, including for the population projections. Appendix B contains a U.S. immigration law timeline. Appendix C includes 1965 to 2065 population tables, and Appendix D contains the survey topline.
“Foreign born” refers to persons born outside of the United States, Puerto Rico or other U.S. territories to parents neither of whom was a U.S. citizen. The terms “foreign born” and “immigrant” are used interchangeably in this report. Unless otherwise noted, recent arrivals include all the newly arrived regardless of their legal status, that is, both legal immigrants and unauthorized immigrants. However, in Pew Research Center survey data, “immigrant” is defined as someone born in another country, regardless of parental citizenship.
“Recent arrivals” or “newly arrived immigrants” refer to foreign-born persons who arrived within five years of the census enumeration or date of the survey. Unless otherwise noted, recent arrivals include all the newly arrived regardless of their legal status, that is, both legal and unauthorized immigrants.
“Legal immigrants” are those who have been granted legal permanent residence; those granted asylum; people admitted as refugees; and people admitted to the U.S. under a set of specific authorized temporary statuses for longer-term residence and work. This group includes “naturalized citizens,” legal immigrants who have become U.S. citizens through naturalization; “legal permanent resident aliens,” who have been granted permission to stay indefinitely in the U.S. as permanent residents, asylees or refugees; and “legal temporary migrants” (including students, diplomats and “high-tech guest workers”), who are allowed to live and, in some cases, work in the U.S. for specific periods of time (usually longer than one year).
“Unauthorized immigrants” are all foreign-born non-citizens residing in the country who are not legal immigrants. This definition reflects standard and customary usage by the U.S. Department of Homeland Security and academic researchers.
Immigrant generations living in the U.S. are as follows: “First generation” refers to the foreign born (see above for definition). “Second generation” refers to people born in the U.S. who have at least one immigrant parent. “Third-and-higher generation” refers to people born in the U.S. with U.S.-born parents.
“U.S. born” refers to individuals who are U.S. citizens at birth, including people born in the United States, Puerto Rico or other U.S. territories, as well as those born elsewhere to parents who were U.S. citizens. The U.S.-born population encompasses the second generation and the third-and-higher generation.
References to all racial groups, including “Other,” refer to only non-Hispanics. References to specific racial groups, such as Asians, blacks and whites, include only single-race individuals. Asians do not include Pacific Islanders, unless otherwise noted. Hispanics are of any race.
“College completion” refers to those who have completed at least a bachelor’s degree. Prior to 1990 it refers to those who have completed at least four years of college.
Persons finishing “some college” have finished at least some college education, including those completing associate degrees. Those completing any college at all, including less than one year, are designated as finishing some college.
A “high school completer” refers to those who have at least obtained a high school diploma or its equivalent (such as a General Educational Development certificate, or GED). Prior to 1990 it refers to those who have completed at least four years of high school.
Throughout this report, the term “Latin America” refers to Central and South America, as well as the Caribbean and Mexico; references to “Central and South America” in Chapter 3 do not include the Caribbean, but do include Mexico, unless otherwise noted. In referring to countries of origin, “South and East Asia” refers to only those regions, while “Asia” refers to the full continent (see Recent Arrivals: Data Sources in Appendix A).


