The nation’s foreign-born population increased sharply between 1970 and 2000, but its rate of growth has since slowed, according to a Pew Research Center analysis of U.S. Census Bureau data. Even so, the share of the U.S. population that is foreign born—13.1% in 2013—is approaching a historic high.24
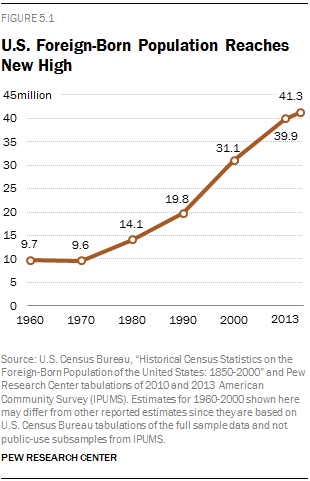
More than 41 million immigrants lived in the U.S. as of 2013, more than four times as many as was the case in 1960 and 1970. By comparison, the U.S.-born population is only about 1.6 times the size it was in 1960. Immigrant population growth alone has accounted for 29% of U.S. population growth since 2000.
With rapid growth since 1970 in the nation’s foreign-born population, its share of the U.S. population has been rising, from 4.7% in 1970 to 13.1% in 2013. This is below the record 14.8% immigrant share in 1890, but this could rise to 18% by 2065 according to new Pew Research Center projections (see Chapter 2).
Not only has the nation’s immigrant population grown rapidly, its demographic characteristics have also changed. In 1970, the majority of immigrants were U.S. citizens (64%), but in 2013 less than half held U.S. citizenship (47%). By 2013, most immigrants were from either Latin America or South or East Asia, a very different profile than that of immigrants in 1960 and 1970, who were mostly from Europe.
This chapter paints a portrait of the U.S. foreign-born population from 1960 to 2013, including trends in countries and regions of birth, time spent living in the U.S., languages spoken, age, geographic settlement in the United States, marital status, and legal status and citizenship.
Accompanying it is a statistical portrait of the nation’s foreign born from 1960 to 2013. Also accompanying this chapter is an online interactive exploring the top country of origin among immigrants in each state from 1850 to 2013, reflecting waves of immigrants from Ireland, Germany, Italy and Mexico, among other countries.
Regions and Countries of Birth
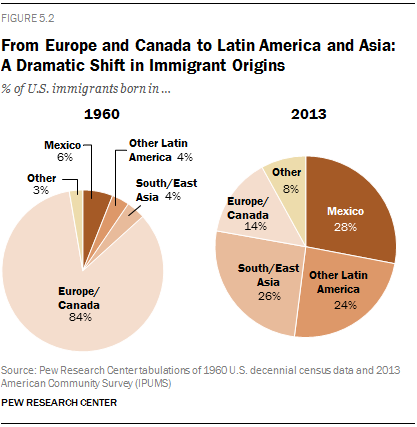
A dramatic shift in the origins of U.S. immigrants has occurred since the passage of the Immigration and Nationality Act of 1965, which eliminated national origin quotas and cleared the way for immigration from non-European countries. In 1960, 84% of the nation’s immigrants were from Europe or Canada. By 1970, that share had dropped to 68% and by 1980 was just 42% as migration from Latin America surged.
Not only did the European and Canadian share among immigrants fall, but so, too, did their numbers. In 1960, 8.2 million immigrants from Europe and Canada were living in the U.S. By 2013, that number had fallen to 5.9 million. Over the same period, the number of immigrants who were born in South or East Asia increased almost thirtyfold, from about 400,000 in 1960 to 10.7 million in 2013. Immigrants from Mexico are not far behind, with about 20 times as many Mexican immigrants in 2013 (11.6 million) as there were in 1960 (600,000).
Immigrant populations born in other parts of the world have also experienced high rates of growth. Immigration from sub-Saharan Africa is the standout, with the population in 2013 (1.5 million) about 133 times that of 1960 (only 11,000) (Anderson, 2015). Foreign-born populations from other parts of Latin America (the Caribbean, South America, Central America) and the Middle East have also increased by factors of 10 or greater.
As of 2013, Mexican immigrants were the single largest source country for the nation’s foreign born, (28%). The region of South or East Asia was not far behind at 26%. Other regions accounting for significant shares of the immigrant population were the Caribbean, at about 10% of the U.S. foreign born, Central America (8%), South America (7%), the Middle East (4%) and sub-Saharan Africa (4%).
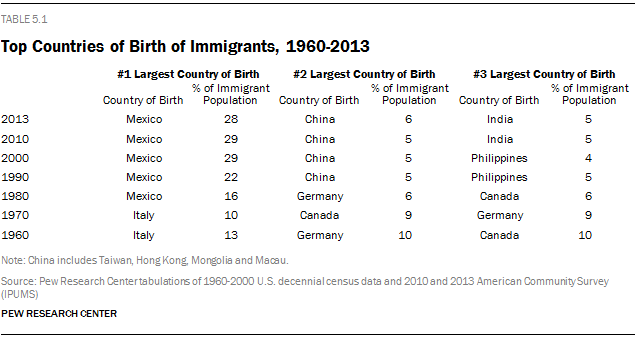
Italy was the top country of origin for U.S. immigrants in 1960 and 1970, followed by Canada and Germany. By 1980, however, the top 10 countries of origin had changed. Mexico shot to the top of the list, and Asian countries (the Philippines and China) were among the top 10. Mexico has been the top country of origin by a wide margin ever since. In 2013, China and India were the second and third biggest countries of origins for U.S. immigrants, respectively.
Looking at the top countries of origin among immigrants in the U.S. by state, there is a shift from 1960 to 2013. In 1960, while Mexico was the biggest country of origin in the border states (California, Arizona, New Mexico and Texas), Canada and European countries such as Italy, Germany and the United Kingdom dominated the rest of the country. In 2013, Mexico was the top country of origin in 33 states, encompassing most of the West, South and Midwest. Immigrants in the remaining states have diverse origins, including the Caribbean, Central America, Canada, South and East Asia and Africa.
From Ireland to Germany to Italy to Mexico: How America’s Source of Immigrants Has Changed in the States, 1850 to 2013
Time Living in the U.S.
The nation’s immigrants are more settled in 2013 than they were in 1990, when the share of those who arrived in the 10-year period before the census or survey was taken peaked.
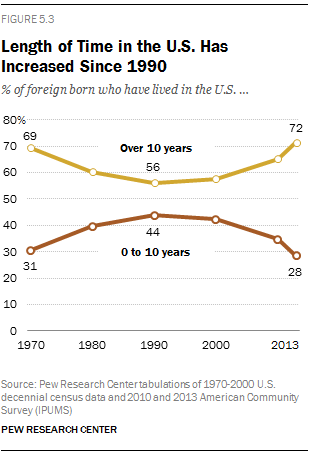
In 1970, 69% of immigrants had lived in the United States for more than 10 years. This share dropped after the influx of immigrants in the 1970s and 1980s, and by 1990 only 56% of immigrants had lived in the U.S. for over a decade. As of 2013, though, this share topped the 1970 share, at 72%.
On the opposite end of the spectrum, the share of the foreign-born population who had immigrated within a decade prior to the survey peaked in 1990, at 44%, up from 31% in 1970. In 2013, this was back to a level similar to that seen in 1970 (28%).
Some regional groups of immigrants followed this pattern of reaching a low in number of years lived in the U.S. around 1980 or 1990. However, several regions experienced a steady decline from 1970 to 2013. For example, the share of South Americans who had immigrated within 10 years of the survey steadily fell in each decade, from 75% in 1970 to 28% in 2013.
A larger share of immigrants from Europe and Canada had arrived in the past 10 years in 2013 (22%) than had done so in 1970 (18%). Over the same period, though, the share of immigrants who had arrived in the past 10 years fell dramatically among those from South and East Asia, Latin America and sub-Saharan Africa.
Language Use
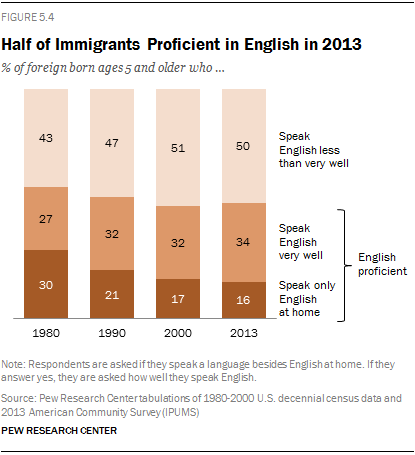
The share of immigrants who speak only English at home declined from 30% in 1980 (the first year the census asked about English-speaking ability) to 2000 (17%), but it has been steady since then, at 16% in 2013.25
Looked at another way, the share of U.S. immigrants who speak English “less than very well” grew from 43% in 1980 to 50% in 2013. Meanwhile, the share who speak English “very well” rose slightly from 27% to 34% over the same period.
Among all immigrants ages 5 and older, 16% say they speak only English at home. The largest share (44%) speak Spanish. An additional 6% say they speak Chinese (Mandarin or Cantonese), and 5% speak “Hindi and related” languages. Other languages spoken include Filipino/Tagalog (4%), Vietnamese (3%), French (3%) and Korean (2%). No other single language accounts for more than 2% of foreign-language immigrant speakers.
Age
Since at least 1960, the foreign-born population has had an older median age than the U.S.-born population. Most people who migrate internationally are of working age and a smaller share of immigrants are children compared with the U.S.-born population. But the gap has narrowed as the two groups took different trajectories, with immigrants getting younger and the U.S. born population getting older. In 1960, immigrants had a median age of 57 years—more than double that of the U.S. born (27), reflecting the slowdown that was taking place in the arrival of new immigrants between the 1920s and the 1960s. The gap rapidly narrowed as a new wave of immigrants arrived in the 1970s, 1980s and 1990s until 2000, when immigrants were on average only two years older than the U.S. born (37 vs. 35). By 2013, the gap had once again widened to a median age of 43 years among the foreign born and 35 years among the U.S. born, reflecting a more recent slowdown in migration from Mexico and other countries (Passel, Cohn and Gonzalez-Barrera, 2012).
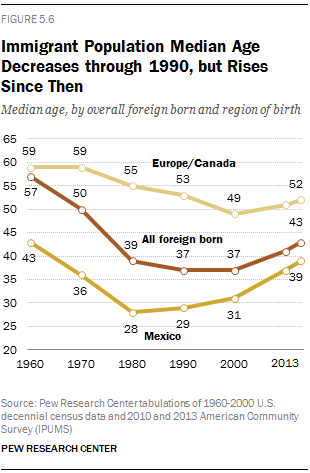
Immigrants from Europe and Canada have long had the highest median age among the foreign born at 59 years in 1960 and 52 years in 2013. As the overall composition of the foreign-born population has shifted from a large majority European and Canadian group to a plurality Mexican group, the median age has shifted more toward that of Mexican immigrants (39 years in 2013, a little younger than 43 years in 1960). South or East Asian immigrants account for another large part of the foreign-born population in 2013, and their median age was 43 years in 2013—up from 38 years in 1960, though it reached a low of 31 years in 1980.
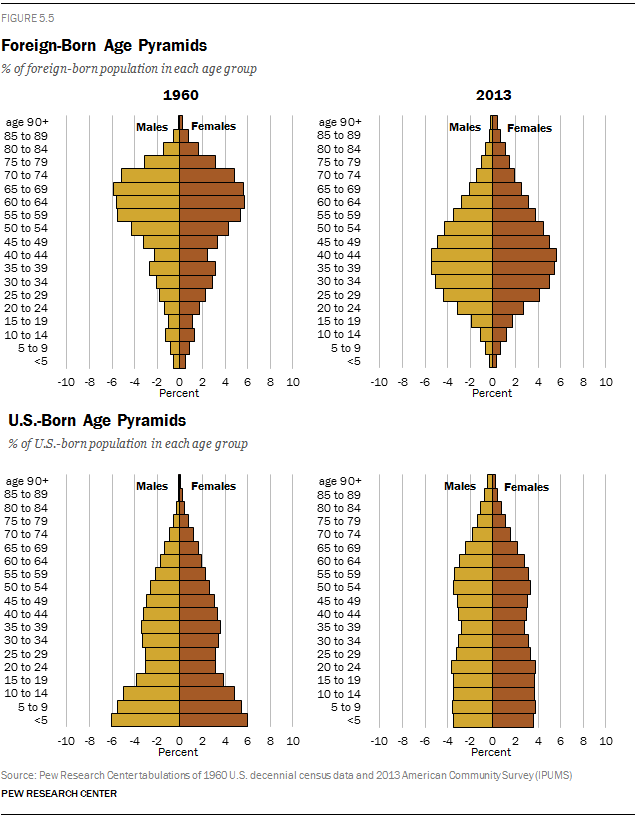
The age pyramid profiles of the foreign-born population also reflect this large shift over the years. In 1960, the foreign-born population was older than today, with a large portion of immigrants between ages 55 and 74. By 2013, though, immigrants were most likely to be between 30 to 49 years old, and the overall age of the population was lower than in previous decades.
The U.S.-born population, meanwhile, is growing older. In 1960, during the tail end of the baby boom, the population skewed young, with the single largest age group younger than age 5. As of 2013, the Baby Boomer generation has aged, and the most recent generation, the Millennials, was a comparable size, creating a more uniform age pyramid.
Geographic Settlement
The South has by far seen the biggest increase in its foreign-born population, from less than 1 million in 1960 to 13 million in 2013. In more recent years, between 2000 and 2013, the foreign-born population in the South increased by 55%. The Northeast, Midwest and West each had more modest increases of about 20% to 30% over the same period. The South and West each accounted for about 40% of the overall change in the U.S. in this period, compared with 14% in the Northeast and 7% in the Midwest.
As the nation’s foreign-born population has more than quadrupled since 1960, many states have experienced exponential growth. In particular, the foreign-born populations in Georgia, Nevada and North Carolina have increased more than thirtyfold. California has had the largest numerical increase, from 1.3 million in 1960 to 10.3 million in 2013.
The share foreign born has risen in most states since 1960. All of the states experiencing decreases are located in the far north (Montana, North and South Dakota, Michigan, Vermont, New Hampshire and Maine).
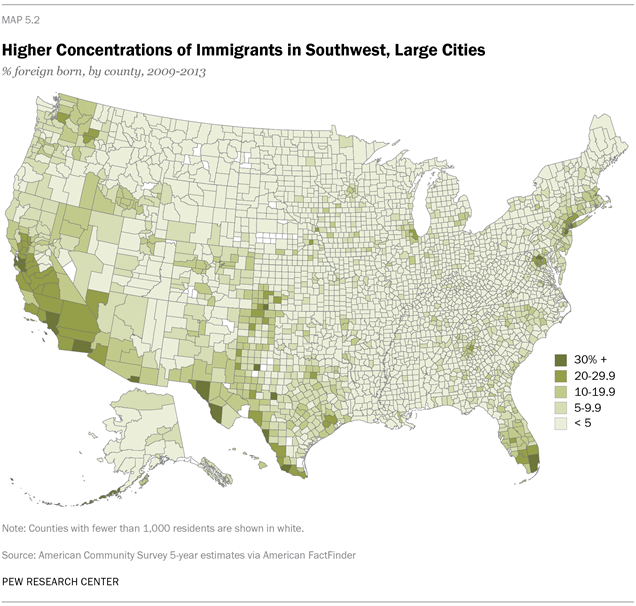
The foreign-born population has become more evenly dispersed across the country over time. For example, nearly half of immigrants (47%) lived in the Northeast in 1960, but only 22% did so in 2013. The share living in the South, meanwhile, increased from 10% in 1960 to 32% in 2013.
Even so, the five U.S. counties with the largest foreign-born populations in 2013 (Los Angeles County, Calif.; Miami-Dade County, Fla.; Cook County, Ill.; Queens County, N.Y.; and Harris County, Tex.) accounted for fully 20% of the U.S. immigrant population. The population has become more dispersed since 1990, when the top five counties accounted for 30% of the immigrant population.
Marital Status
Among immigrants to the U.S., the share who are married has declined steadily since 1960 (from 68% in 1960 to 60% in 2013). The decline comes as immigrants are more than twice as likely to have never been married as they were in 1960 (24% in 2013, up from 10% in 1960) and more likely to be divorced and separated.
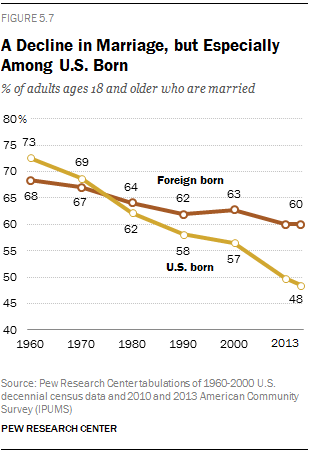
This decline in marriage rates among immigrants is a small change compared with the trend among their U.S.-born counterparts. Among those born in the U.S., the share who are married fell from 73% in 1960 to just 48% in 2013, as the share never married rose from 15% to 31% over the same period. The share that is separated, divorced and widowed follows similar patterns to those of the foreign born.
The share of people who live in a married couple household has taken a similar trajectory. In 1960, 77% of immigrants lived in a married couple household, compared with 64% in 2013. The share fell even more steeply among the U.S. born, from 85% to 59%.
Meanwhile, the shares of both the foreign born and the U.S. born living in female householder, male householder, or non-family households have all risen. The share of immigrants living in households with a female householder almost doubled, from 7% in 1960 to 14% in 2013, with a similar pattern among the U.S. born (8% to 18%). Some 4% of the foreign-born population lived in households headed by a male householder in 1960, rising to 9% in 2013 (compared with 2%, increasing to 6% among the U.S. born). While the share of immigrants living in non-family households has been relatively stable (at 12% in 1960 and 13% in 2013), those born in the U.S. are more than three times as likely to be living in a non-family unit as they were in 1960 (5% in 1960, compared with 17% in 2013).
Legal Status of U.S. Immigrants
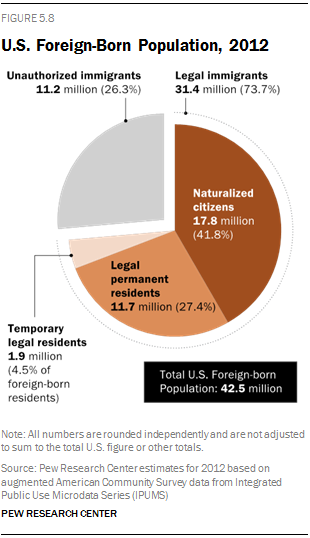
As of 2012, the plurality of immigrants were naturalized citizens, at 42%. An additional 27% were legal permanent residents, and 4.5% of foreign-born residents are temporary legal residents such as students. As of 2012, unauthorized immigrants—those in the country illegally—made up about a quarter of the foreign-born population (26%), numbering more than 11 million (Passel, Cohn, Krogstad and Gonzalez-Barrera, 2014).
From 1990 to 2007, the unauthorized immigrant population grew sharply and steadily, rising from 3.5 million to a peak of 12.2 million in 2007—more than tripling within two decades. Since then, though, growth has leveled off. The population stood at 11.3 million in 2014, statistically unchanged since 2009 (Passel and Cohn, 2015).
A slowdown in immigration from Mexico is responsible for much of this leveling off (Gonzalez-Barrera and Krogstad, 2015). The number of unauthorized Mexican immigrants peaked at 6.9 million in 2007 and has been on the decline ever since, reaching 5.9 million in 2012 (Passel and Cohn, 2014). Mexicans make up a slight majority of unauthorized immigrants (52% in 2012).


