Today’s recently arrived immigrants are sharply different from their counterparts of 50 years ago, not only in their origins and current states of residence, but also in their education levels, occupations and economic well-being, according to a Pew Research Center analysis of U.S. Census Bureau data. Most visibly, Asia is now the largest region of origin among recently arrived immigrants—those who have been in the U.S. for five years or less—supplanting Central and South America in 2011.12
Newly arrived immigrants today also are markedly better educated than their counterparts of 50 years ago, and have narrowed their schooling gap with the U.S.-born population. About half work in managerial, professional, and sales and administrative support jobs, a higher share than in any decade from 1970 on. However, they also are more likely to be living in poverty than in 1970, and their family incomes are no higher.
The broad rewrite of the nation’s immigration law in 1965, which ended a longstanding national origins quota system that favored Europe, was an important facilitator of these changes. Its passage is linked to the third great wave of immigration to the United States—a wave that continues today. Since 1965, nearly 59 million immigrants have come to the U.S.
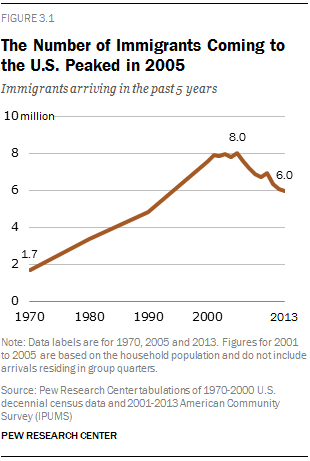
But more changes are underway. After increasing steadily for three decades, the number of new immigrant arrivals appears to have peaked around 2005 and then began to fall.
The decline is mainly the result of an abrupt slowdown over the past decade in unauthorized immigration, mainly from Mexico. Hispanic immigration to the U.S.—both legal and illegal—crested in the early 2000s, and the share of new arrivals who are Hispanic is at its lowest level in 50 years.
From Europe to the Americas to Asia: The Changing Origins of Newly Arrived Immigrants
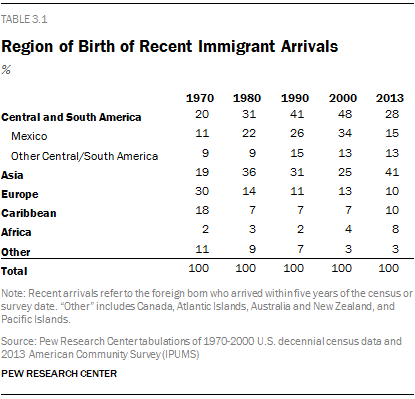
Since passage of the 1965 immigration law, the dominant region of origin of new immigrants has shifted three times. In earlier waves of immigration, most arrivals came from Europe, and this trend continued even into 1970, when a plurality of recently arrived immigrants was from there (30%). Meanwhile, roughly equal shares of recent immigrants were from Central and South America (20%), Asia (19%) and the Caribbean (18%), regions that had long had little representation among newly arrived immigrants.13
By 1980, patterns shifted as growth in immigration from Asia and from Mexico increased. As a result, new immigrants from Asia (36%) and Central and South America, including Mexico, (31%) outnumbered the share arriving from Europe (14%).
Immigration from Central and South America grew rapidly through the 1980s, increasing the share of newly arrived immigrants in 1990 from these countries to 41%, making the region the top sender of immigrants to the U.S. Throughout the 1990s, immigration from the region—especially from Mexico—continued to grow. As a result, by 2000, Mexico alone accounted for a third (34%) of recent immigrants, up from just 11% in 1970. And the total from Central and South America reached 48%.
More recently, there has been another change. An abrupt slowdown in new immigration from Mexico, especially of unauthorized immigrants (Passel, Cohn and Gonzalez-Barrera, 2013), reduced the Mexican share of new arrivals to only 15% by 2013. Altogether, new immigrants from Central and South America represented just 28% of the total in 2013.
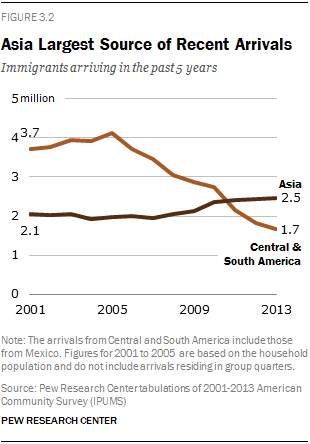
At the same time, immigration from Asia increased. The number of new arrivals from Asia, fueled in part by the greater propensity of Asian immigrants to obtain green cards based on employer sponsorship, grew 30% between 2000 and 2013 (Pew Research Center, 2012). By 2011, new arrivals from Asia were the single largest origin group among new immigrants. By 2013, their share had grown to 41% of new arrivals, the highest share from that continent in U.S. history.
Europe accounted for only one-in-ten new immigrants to the U.S. in 2013, even though it had been the main source of the U.S. foreign-born population for most of the nation’s history. In 1910, for example, 89% of recently arrived immigrants came from Europe.
Immigration from Africa also has picked up markedly (Anderson, 2015) and accounted for 8% of new arrivals in 2013, quadruple its share among newly arrived immigrants in 1970.
The Number of New Arrivals
Even though Europe’s share of new arrivals has declined since the 1970s, the absolute number of new immigrants from Europe grew, then receded. In 2013, the number of new European arrivals stood at 580,000, slightly higher than the 520,000 European immigrants who were newly arrived in 1970.
The number of new immigrants from Central and South America, dominated by Mexico, grew more than tenfold in the first three decades since the 1965 Immigration and Nationality Act’s enactment. In 2000, about 2.6 million immigrants from Mexico and an additional 1 million from other Central and South American nations had recently settled in the U.S. By comparison, the 1970 census recorded less than 350,000 newly arrived Central and South American immigrants, including 188,000 from Mexico. More recently, immigration from Mexico and other Central and South American countries has diminished. For example, in 2013 only 900,000 immigrants from Mexico recently arrived here, down from a peak of 2.8 million in 2005.
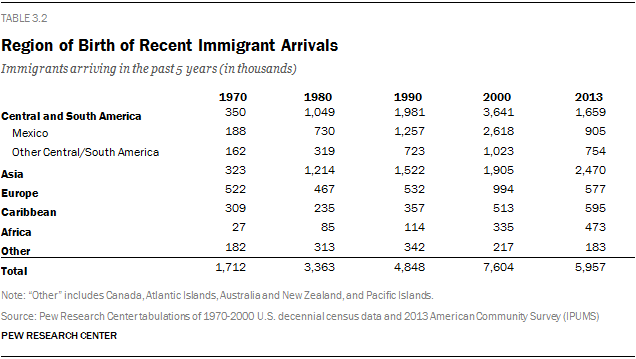
In 2013, there were 2.5 million recently arrived immigrants from Asia, a more than sevenfold increase since 1970. New immigration from Asia nearly quadrupled in the 1970s, and it grew by about a quarter in the 1980s and again in the 1990s.
The number of newly arrived immigrants from the Caribbean and Africa also has grown. New Caribbean immigrants now exceed those from Europe. The number of newly arrived immigrants from Africa grew 41% from 2000 to 2013, a sharper rise than for other major groups.
The Changing Demographics of the Newly Arrived
Settlement
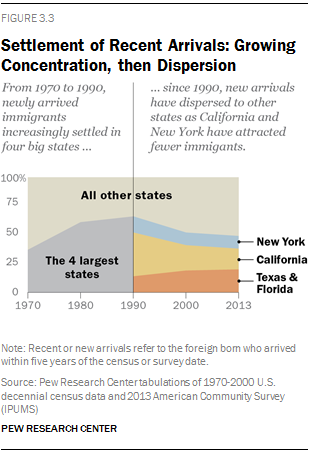
In the two decades after passage of the Immigration and Nationality Act, newly arrived immigrants increasingly settled in four large states—California, New York, Texas and Florida. In 1970, these four magnet states were home to only about one-in-three new immigrants. By 1980, more than half of newly arrived immigrants lived in these four states, and by 1990, nearly two-thirds did.
In recent years, though, new arrivals have dispersed more widely across the country. In 2013, half of new arrivals lived in states other than the big four. Meanwhile, these four states have somewhat different patterns of change. The share of newly arrived immigrants settling in Texas and Florida has grown steadily since 1970, but the share settling in the other two states declined—markedly so in California. Fully 38% of recently arrived immigrants lived in the Golden State in 1990, but that share declined to 18% in 2013.
Since 1990, many states that previously had little exposure to international migration became the new home for recent arrivals.
Racial and Ethnic Background
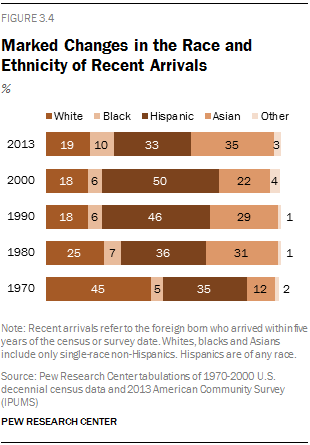
Accompanying the change in the national origins of recently arrived immigrants was a shift in their racial and ethnic backgrounds. The share of new immigrants who are white, 45% in 1970, was 19% in 2013. Asians represented 35% of recent arrivals in 2013, about triple their share in 1970 (12%). Hispanics were a third of recent arrivals in 2013, after peaking at 50% in 2000. Their share of the total in 2013 was about the same as in 1970, when it was 35%.14
Gender
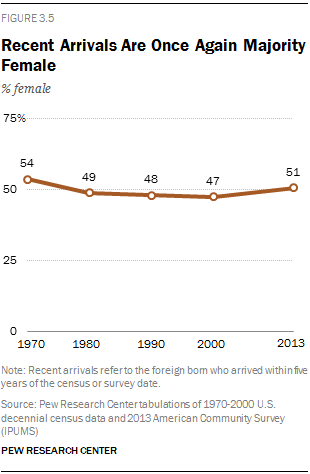
Following the 1965 Immigration and Nationality Act, a rising proportion of new arrivals were men. By 2000 a majority (53%) of new arrivals were men, up from less than half (46%) in 1970. However, in the 2000s, the gender pattern reversed, with women accounting for a majority (51%) of recent arrivals in 2013.
The changing gender pattern for recent immigrants is explained in part by the rise and fall of unauthorized immigration. Unauthorized immigrants are more likely to be men (Fry, 2006). As the number of unauthorized immigrants grew in the decades after passage of the 1965 law, so did the male share of recently arrived immigrants. Yet as the flow of unauthorized immigrants fell sharply in the wake of the Great Recession (Passel and Cohn, 2010, Passel, Cohn, and Gonzalez-Barrera, 2013), the female share of recent arrivals increased.
The temporary U.S. trend toward a more male-dominated immigration flow was noteworthy in part because of its rarity. In many countries of the world, women have constituted a rising share of international migrants since 1960 (United Nations Population Fund, 2006).
Age
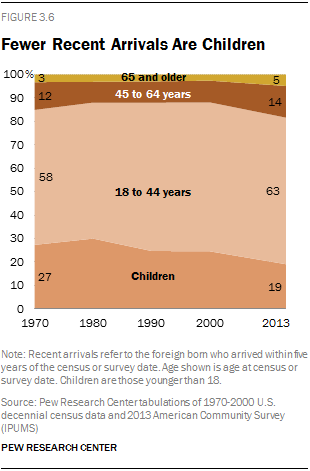
The age of newly arrived immigrants has not significantly changed since 1970. The majority of new arrivals are 18 to 44 years old. Relatively few new arrivals are children. In 1980, 30% of recently arrived immigrants were children. While the 1965 law emphasized family reunification, the share of newly arrived immigrants who are children has steadily declined to less than 20% in 2013.
Newly Arrived Immigrants Better Educated than in 1970, but Many Live in Poverty
Education
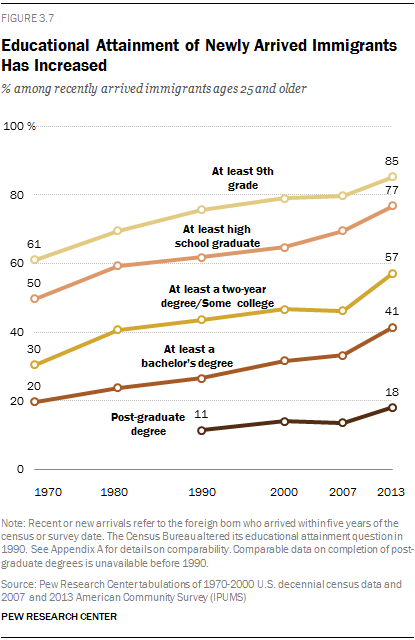
Regardless of the educational benchmark chosen, those coming to the U.S. are much better educated than their counterparts of 50 years ago. Among adults ages 25 and older, a larger share in 2013 had a high school diploma, a college degree or an advanced degree, and a smaller share had less than a ninth-grade education. For example, half of newly arrived immigrants in 1970 had at least a high school education; in 2013, more than three-quarters did. In 1970, a fifth had graduated from college; in 2013, 41% had done so.
The improved levels of education attainment of recently arrived immigrants partly reflects rising education levels worldwide. In 2010, 45% of the world’s population had attended secondary school, up from less than 20% in 1960 (Morrison and Murtin, 2010). Among adults ages 20 to 24 in Mexico, which has been the largest source country of U.S. immigrants, the share with a secondary school education grew to a majority in 2010, compared with less than 10% in 1965 (Barro and Lee, 2013).
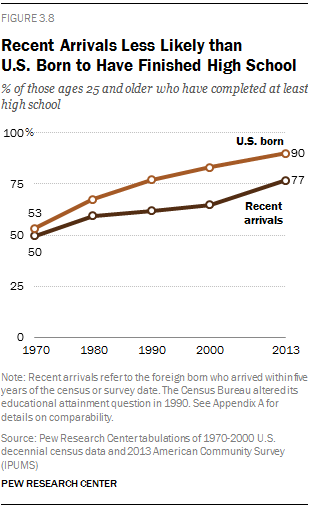
Compared with U.S.-born adults, recent arrivals are less likely to have finished high school, but they are more likely to have completed college or to hold an advanced degree.
The gap in high school completion between recent immigrant arrivals and the U.S. born was only four percentage points in 1970, but it widened to 18 points by 2000, reflecting a slowed increase in education levels of recent immigrants even as levels among the U.S. born steadily rose. Subsequently, the gap narrowed to 13 percentage points in 2013: 77% of recent immigrants and 90% of U.S.-born adults had completed high school.
In 1970, recently arrived immigrants (30%) were more likely than U.S.-born adults (23%) to have completed at least some college. However, U.S.-born adults surpassed newly arrived immigrants by 1990. In 2013, 57% of newly arrived immigrants had completed at least some college, compared with 61% of U.S. adults. But this is due entirely to the higher share of U.S. born adults who have some college education, but no degree.
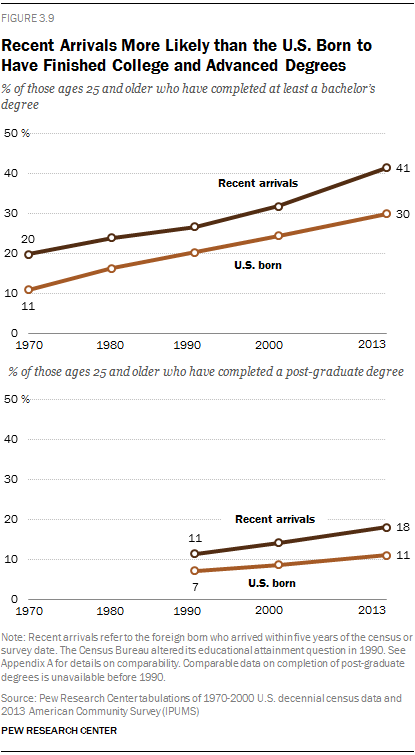
Throughout the past 50 years newly arrived immigrants have been more likely than their U.S.-born peers to have finished at least a bachelor’s degree. In 1970, about one-in-five newly arrived immigrants had at least a bachelor’s degree compared with slightly more than one-in-ten U.S.-born adults. The immigrant advantage in college completion narrowed through the 1990s and 2000s until recently, when it began to widen again. The gap in 2013 was wider than that observed in 1970, reflecting the recent shift in the origins of newly arrived immigrants. In 2013, 41% of newly arrived immigrants had completed at least a bachelor’s degree, compared with 30% of U.S.-born adults.
Newly arrived immigrants also are more likely than U.S.-born adults to hold advanced degrees: In 2013, 18% did so, compared with 11% among those born in the U.S.15
Occupation
In 1970, 42% of newly arrived immigrants were in managerial, professional, technical, sales and administrative support occupations. But as more immigrants arrived in the 1980s, 1990s and 2000s, the share in these occupations fell, until recently. Similarly, in 1970, 28% of new arrivals were operatives and laborers. The share of new arrivals working in this broad occupational group has also steadily contracted over the decades.
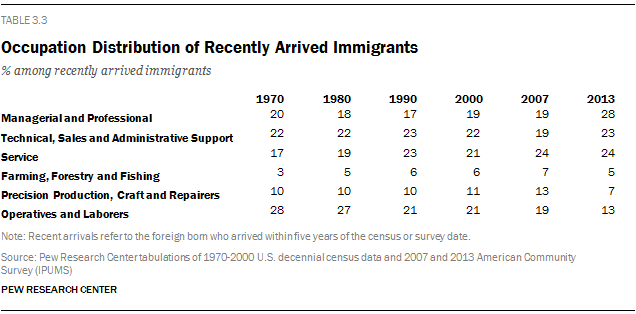
However, the long-term trends hide some variation in shorter-term patterns. A rise in the share of newly arrived immigrants holding managerial and professional jobs, which tend to require more education, has taken place since 2007. This has coincided with the shift to Asia as a source region and the downturn in unauthorized immigration. Only 19% of new arrivals held those jobs in 2007, compared with 28% in 2013. Similarly, in 2007 only 19% of recent arrivals were employed in technical, sales and administrative support occupations, compared with 23% in 2013. The share of recent arrivals holding service jobs—which include a broad array of employment from fast-food workers to law enforcement—rose in most decades except the 1990s.
Family Income
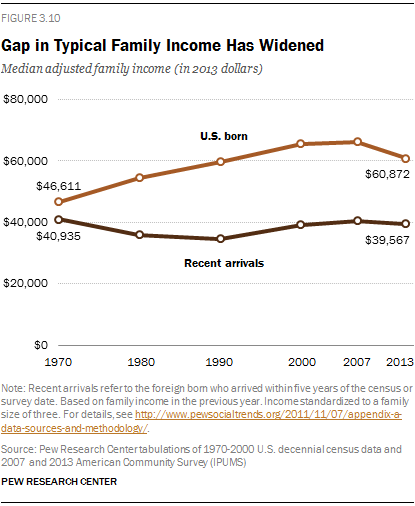
The gap between recent arrivals and the U.S.-born population in median family income widened considerably during the first few decades after passage of the 1965 Immigration and Nationality Act. However, it has narrowed more recently as U.S.-born family incomes plummeted after the Great Recession.
In 2013, newly arrived immigrants had lower adjusted median family incomes than the U.S. born – $40,000 compared with $61,000. The gap in 2013 was also wider than it was in 1970.16
Family incomes of newly arrived immigrants have not exceeded their 1970 levels in any subsequent decade. Median adjusted family incomes of U.S.-born residents were larger in 2013 than in 1970, but lower than they were when the recession began in 2007.
These income calculations incorporate changes in family size over time. Family size has fallen more sharply for the U.S. born than for recently arrived immigrants.17 The average family size for both groups was nearly equal in 1970, but it was somewhat larger for new immigrants (3.5) than for the U.S. born (3.1) in 2013. All other things being equal, larger families are worse off than smaller ones with the same income because there are more people to feed, clothe and otherwise support.
Poverty
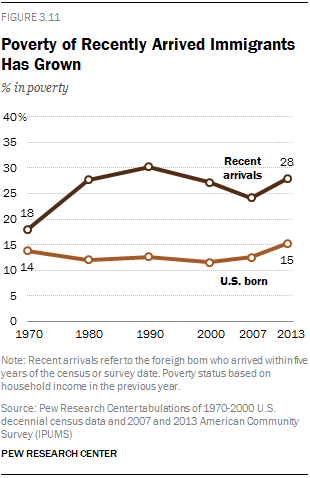
As with median family income, the share of recent immigrants in poverty is higher than for the U.S. born, and the gap has grown since 1970 (DeNavas-Walt and Proctor, 2014).18
In 1970, 18% of newly arrived immigrants lived below the official poverty line. Poverty among newly arrived immigrants trended upward until 1990, when it reached 30%. Poverty among recent immigrants fell after 1990 and was 24% in 2007. The Great Recession and weak recovery pushed poverty among recent immigrants to 28% in 2013.
Poverty among the U.S.-born population remained relatively steady at about 12% to 13% over most of the past 50 years. In the aftermath of the Great Recession, poverty peaked at 15% in 2013. The gap in poverty rates between recent arrivals and the U.S. born peaked in 1990 (at 18 percentage points); in 2013, it was 13 points.
The Impact of Changing Region of Origin
Earlier sections of this chapter documented the dramatic changes in the origins of recent immigrants to the U.S. since the 1965 Immigration and Nationality Act and the overall changes for recent immigrants in certain characteristics. This section looks in more detail at the trends in educational attainment and family incomes of recent immigrants by region of origin.
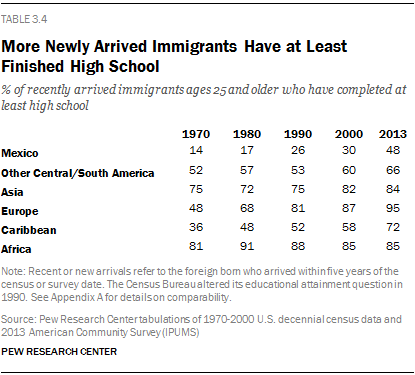
Immigrants to the U.S. in recent years are better educated than earlier immigrants, both because of overall changes in region of origin and the fact that immigrants from every major region are better educated than their counterparts were in 1970.
Recent arrivals from Mexico in 2013 were three times as likely to have at least completed high school as those who came prior to 1970. In 1970, 14% of Mexican arrivals ages 25 and older had finished high school. By 2013, 48% of Mexican recent arrivals had completed that education level.
In 2013, 95% of European arrivals had finished high school. This is nearly twice the level of high school completion by Europeans arriving in the five years prior to 1970 (48%). High school completion among immigrants coming from the Caribbean has doubled in the past 50 years. In 2013, 72% of Caribbean arrivals had finished high school, up from 36% in 1970.
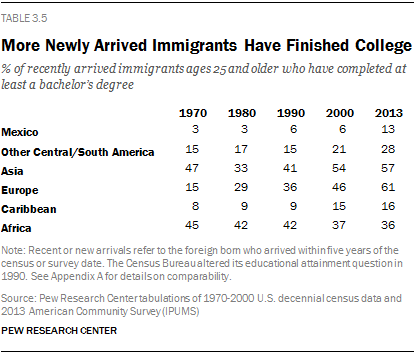
In terms of college, there has been a steady upward march in the attainment of immigrants coming from Europe. In 1970, only 15% of European recent immigrants had at least a bachelor’s degree. By 2013, more than 60% of European immigrants had finished college.
The prominent exception to this upward trend in educational attainment is among recent immigrants from Africa, who were among the most educated immigrants in 1970. In 1970, 45% of recent immigrants from Africa ages 25 and older had completed at least a bachelor’s degree (at that time only 11% of the similarly aged U.S.-born population was college-educated). In 2013, 36% of new arrivals from Africa had finished at least a bachelor’s degree.
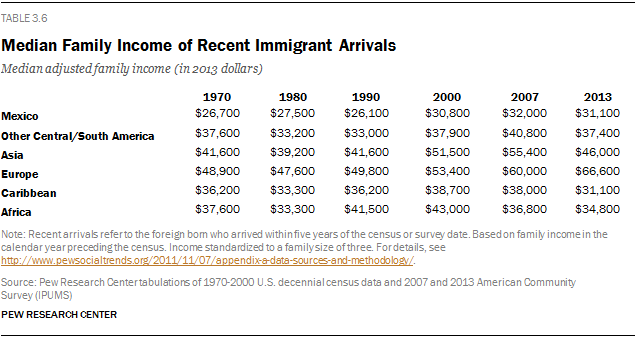
In regard to median adjusted family income, the overall stagnation in this measure among all recent immigrants hides some variation among national origin groups over the past half century. Median adjusted family income was larger in 2013 than in 1970 for recent arrivals from Mexico, Asia and especially Europe. It stagnated or declined for those from the rest of Central and South America, the Caribbean and Africa. The sharpest change in this measure was among recent immigrants from Europe, whose median adjusted family income increased by more than a third, from $48,900 in 1970 to $66,600 in 2013. The typical family income of recent arrivals from Mexico increased from $26,700 in 1970 to $31,100 in 2013. Though the median family income of new arrivals from Asia was higher before the Great Recession ($55,400 in 2007), over the long haul since the 1965 Immigration and Nationality Act, the median family income of immigrants from Asia increased from $41,600 in 1970 to $46,000 in 2013.


