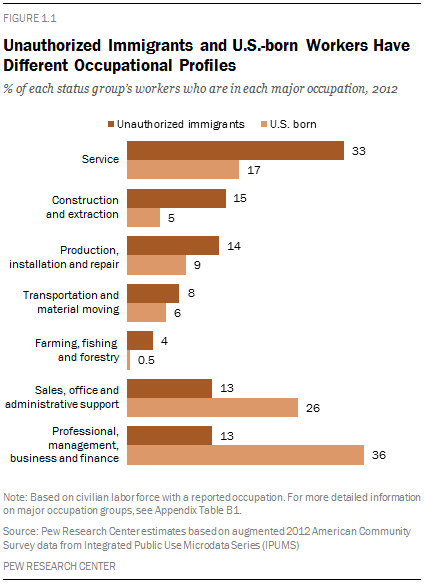
In 2012, fully a third of U.S. unauthorized immigrants in the workforce (33%) held service jobs such as janitor, child care worker or cook, nearly double the share of U.S.-born workers (17%) in those types of occupations. An additional 15% hold construction or extraction jobs (mainly construction), triple the share of U.S.-born workers who hold that type of employment. Overall, 11%, compared with 6% of U.S.-born workers, are employed in production jobs, which include manufacturing, food processing and textile workers, among others.
Among major occupational categories, unauthorized immigrant workers are less likely than U.S.-born workers to hold management or professional jobs, which tend to be higher paid. Only 5% hold management jobs, compared with 15% of U.S.-born workers. Some 7% are employed in professional occupations, compared with 21% of U.S.-born workers. Unauthorized immigrants also are less concentrated in sales jobs or in office and administrative support jobs. Some 7% of unauthorized immigrants hold sales jobs, compared with 12% of U.S.-born workers; 6% hold office and administrative support jobs, compared with 15% of U.S.-born workers.
Because they are concentrated in certain types of jobs, unauthorized immigrants represent a higher share of workers within some occupations, especially blue-collar work, than their 5% share of the overall workforce. For example, in 2012, they were 26% of workers in farming, fishing and forestry occupations, mainly working in agricultural occupations. They are 14% of construction and extraction workers and 9% of workers in production and service jobs. However, they are only 2% of workers in management, professional and office support occupations.
Unauthorized immigrant workers hold an especially high share of jobs in subsets of some detailed occupations, in some cases outnumbering legal immigrants, though not U.S.-born workers. These occupations include drywall installers (where 34% of job-holders were estimated to be unauthorized immigrants in 2012), maids or housekeeping cleaners (25%) and construction painters (24%).
See the appendix for tables on unauthorized immigrants in major occupation groups (Table B1), and detailed occupations (Table B2).
Trends in Major Occupations
The number of unauthorized immigrants working in the three largest occupations—construction, production and service—increased from 1995 to 2007, but the total either leveled off or declined after that.
Among construction workers, the number of unauthorized immigrants declined from 1.6 million in 2007 to 1.2 million in 2012 (a 23% decline), a period in which total U.S. construction employment fell to from 9.9 million to 8.5 million (a 15% decline). Unauthorized immigrants rose from 5% of all construction workers in 1995 to 9% in 2000 before peaking at 16% in 2007 and 2008. The share bumped downward to 14% in 2012.
In production jobs, which include assemblers, food processors, machinists, power plant operators and garment workers, the number of unauthorized immigrants grew from about 750,000 in 1995 to 975,000 in 2007, then declined to 875,000 in 2012 (an 11% decrease). The nation’s total production jobs declined to 9.5 million from 10.2 million from 2007 to 2012(a 7% decrease). The unauthorized immigrant share of the total production workforce grew from 6% in 1995 to 10% in 2007, before levelling off at 9% in 2012.
The number of unauthorized immigrant workers holding service jobs changed little (2% increase), but unauthorized immigrants became a smaller share of the service job workforce between 2007 and 2012 because the total number of U.S. service jobs rose, to 29 million from 26 million (a 12% increase). The unauthorized immigrant share of the total workforce in service jobs grew from 6% in 1995 to 10% in 2007, before levelling off at 9% in 2012.
For farming jobs, a sharp rise in the unauthorized immigrant share of these occupations—from 5% of the total in 1995 to 27% in 2007—also ended, and there was little change in this group’s share of farming jobs by 2012 (26%). The number of unauthorized immigrants in farming jobs, about 325,000 in 2012, rose only 2% from 2007 to 2012. Total employment in farming jobs rose by 6% from 2007 to 2012, to 1.2 million.
State Occupation Patterns
This report includes estimates of the number of unauthorized immigrant workers by occupation in 43 states and the District of Columbia where there are enough unauthorized immigrants in the workforce to provide reliable estimates.
Service occupations are the top job category for unauthorized immigrants in most states. In 39 states and the District of Columbia, service occupations have the largest number of unauthorized immigrants (and share of the unauthorized immigrant workforce in those jobs). Overall, service occupations make up 19% of the total U.S. workforce and 33% of the unauthorized immigrant workforce nationwide. Construction and production occupations—which account for 5% and 6%, respectively, of the total U.S. workforce—also have large representation of unauthorized immigrant workers in many states.
However, unauthorized immigrants represent the largest share of the total workforce in farming occupations in most states. In 34 states, the occupation in which unauthorized immigrants are the largest share of the workforce is farming, fishing and forestry. Nationally, 26% of the farming workforce consists of unauthorized immigrants, the highest share among occupation categories. Because farming jobs employ less than 1% of the total U.S. workforce, compared with the larger shares employed in occupations such as service and construction, there are few states where agricultural occupations account for a significant share of the total unauthorized immigrant workforce.


