The unauthorized immigrant estimates throughout this report are produced using a multistage method that subtracts the legal foreign-born population from the total adjusted foreign-born population; the residual then is used as the source of information about unauthorized immigrants. The main source of data for estimates from 2005 on is the U.S. Census Bureau’s American Community Survey; estimates for 1995 and 2000 use the bureau’s March Current Population Surveys. See Passel and Cohn 2014 for more detail.
“Foreign born” refers to an individual who is not a U.S. citizen at birth or who, in other words, was born outside the U.S., Puerto Rico or other U.S. territories and whose parents were not U.S. citizens. The terms “foreign born” and “immigrant” are used interchangeably. “U.S. born” refers to an individual who is a U.S. citizen at birth, including people born in the United States, Puerto Rico or other U.S. territories, as well as those born elsewhere to parents who were U.S. citizens. When referring to children of unauthorized immigrants, the terms “U.S. born” and “U.S. citizen” are used interchangeably; a small number of these children may be naturalized citizens.
The “legal immigrant” population is defined as people who have been granted legal permanent residence; those granted asylum; people admitted as refugees; and people admitted to the U.S. under a set of specific authorized temporary statuses for longer-term residence and work. This group includes “naturalized citizens,” legal immigrants who have become U.S. citizens through naturalization; “legal permanent resident aliens” who have been granted permission to stay indefinitely in the U.S. as permanent residents, asylees or refugees; and “legal temporary migrants” (including students, diplomats and “high-tech guest workers”) who are allowed to live and, in some cases, work in the U.S. for specific periods of time (usually longer than one year).
“Unauthorized immigrants” are all foreign-born noncitizens residing in the country who are not “legal immigrants.” These definitions reflect standard and customary usage by the U.S. Department of Homeland Security and academic researchers. The vast majority of unauthorized immigrants entered the country without valid documents or arrived with valid visas but stayed past their visa expiration date or otherwise violated the terms of their admission. Some who entered as unauthorized immigrants or violated terms of admission have obtained work authorization by applying for adjustment to legal permanent status, obtaining Temporary Protected Status (TPS) or receiving Deferred Action for Childhood Arrivals (DACA) status. Data are very limited, but this “quasi-legal” group could account for as much as 10% of the unauthorized immigrant population. Many could also revert to unauthorized status.
The “labor force” refers to people ages 16 and older who are employed or looking for work.
Rounding of Estimates. All estimates for immigrant populations, legal and unauthorized, are presented as rounded numbers to avoid the appearance of unwarranted precision in the estimates. The rounding conventions for immigrant estimates, dependent somewhat on data sources, are:
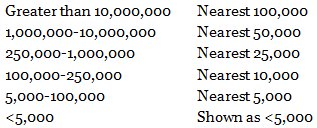
State and national data for the total and U.S.-born populations are rounded to the nearest 10,000. Unrounded numbers are used for significance tests, for plotting charts and for computations of differences and percentages. Where differences are reported, they are computed from unrounded estimates and then rounded separately. Because each figure is rounded separately, the rounded estimates may not add to rounded totals. Similarly, percentages computed from rounded numbers may differ from the percentages shown in this report.
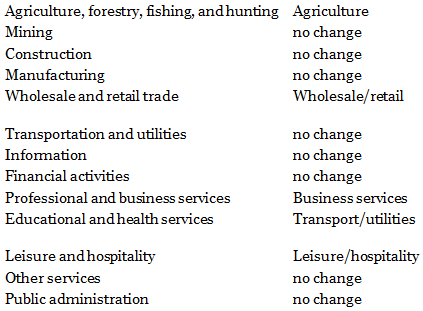
Industry and Occupation Category Labels. For ease of presentation, the full titles of many industry and occupation categories have been condensed from the Census Bureau’s terminology. Data on what are called “major” industry categories are shown in Tables A2, A4 and A8, as well as in some figures in the text. Table A8 includes the full names of the industry categories, but in Tables A2 and A4 and the text, they are shortened as follows:
Data on “major” occupation categories are shown in Tables A3, A5 and A9, as well as in some figures in the text. Table A9 includes the full names of the industry categories, but in Tables A3 and A5 and the text, they are shortened as follows:
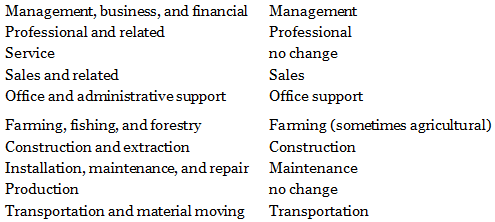
The specific, detailed categories for industries and occupations used in Tables A6 and A7 are not condensed. References in the text, text charts and tables can be cross-referenced to the lists above.


