The most notable trend in the national origins of unauthorized immigrants over the past five years has been the continued decline in the number and share born in Mexico. The population of Mexican-born unauthorized immigrants, 2.9 million in 1995, peaked in 2007 at 6.9 million and declined to 6.4 million in 2009. Even as the number of unauthorized immigrants stabilized overall, the number of Mexicans continued to decline, to 5.9 million in 2012.
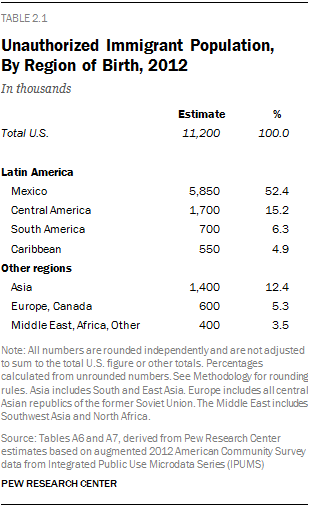
Meanwhile, populations of unauthorized immigrants grew from 2009 to 2012 among all other regions of birth except South America and a grouping of Europe and Canada. There were relatively small but statistically significant increases in totals from Central America, the Caribbean, Asia and a grouping from the world’s remaining nations.
Driven largely by the marked decline in Mexicans, the shares of unauthorized immigrants from other nations and regions have grown. Mexicans were 52% of unauthorized immigrants in 2012, compared with 56% in 2009. Except for South America, shares rose somewhat during that period from all other regions—including Central America (to 15% in 2012), the Caribbean (5%), Asia (12%), a grouping of Europe and Canada (5%) and a grouping from remaining nations (3%). South America accounted for 6% of unauthorized immigrants in 2012.
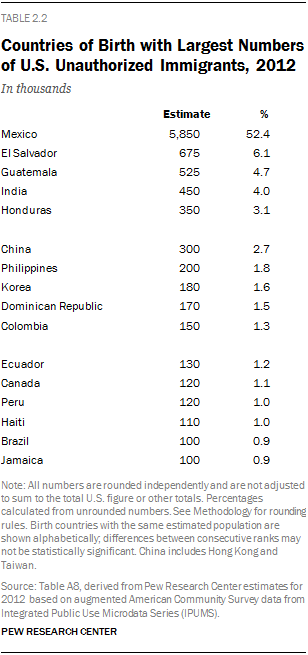
Mexico has been the top source of the number of unauthorized immigrants since at least 1995, the first year of Pew Research data analysis, and other analyses have found that it has held that place in earlier decades as well.3
After top-ranked Mexico, the next five top source countries of unauthorized immigrants have been the same since 2005. Ranking second, with considerably fewer unauthorized immigrants than Mexico, is El Salvador (675,000 in 2012). It is followed by Guatemala (525,000), India (450,000) and Honduras (350,000), China (300,000) and the Philippines (200,000). Rounding out the top 10 in 2012 are Korea (180,000), the Dominican Republic (170,000) and Colombia (150,000).
The sudden reversal of a long trend of growth in the number of Mexican unauthorized immigrants probably results from both a marked decline in new arrivals and an increase in departures to Mexico (Passel, Cohn, and Gonzalez-Barrera, 2012). These trends are evident in government data, mainly from the Census Bureau, analyzed by Pew Research.
State-Level Patterns
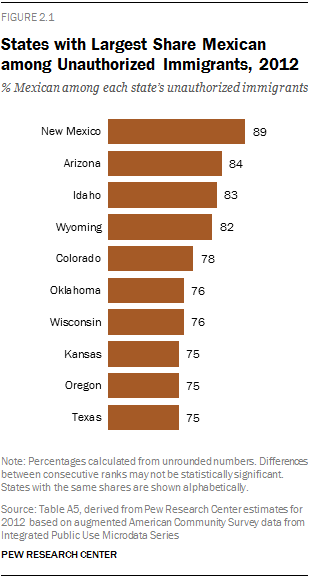
Among the 44 states (and District of Columbia)4 for which data about national origin are available, Mexicans make up the majority of all unauthorized immigrants in 26 of them. The four states where Mexicans make up more than eight-in-ten unauthorized immigrants are all in the West—New Mexico (89%), Arizona (84%), Idaho (83%) and Wyoming (82%).
States with low shares of Mexicans include some in the Northeast: New Hampshire (7%), Rhode Island (6%) and Massachusetts (3%). Hawaii’s share was 7%.
Even in states where Mexicans are not the majority of unauthorized immigrants, they are frequently the largest national origin group—36 states have more Mexicans than any other unauthorized immigrants. Mexicans are not the largest group in three New England states, the area around the nation’s capital (the District of Columbia, Maryland and Virginia), as well as Alaska, Hawaii and Louisiana.
They include New Hampshire (where India is the largest birth country), Massachusetts (El Salvador) and Rhode Island (Guatemala). In Maryland, the District of Columbia and Virginia, unauthorized immigrants from El Salvador constitute the largest group. Hondurans outnumber Mexicans in Louisiana. In Alaska and Hawaii, unauthorized immigrants from the Philippines are the largest group, representing a majority of Alaska’s unauthorized immigrant population and almost half of Hawaii’s.
Because Mexicans are the largest origin group in so many states, their trends have an important impact on state-level populations. In states where unauthorized immigrant populations declined from 2009 to 2012, it was mainly because the number of Mexicans decreased, according to Pew Research analysis.
In 13 of the 14 states where unauthorized immigrant numbers declined from 2009 to 2012, the decreases were due to drops in the number from Mexico, according to Pew Research analysis. Those states were Alabama, Arizona, California, Colorado, Georgia, Illinois, Indiana, Kansas, Kentucky, Nevada, New Mexico, New York and Oregon. In Massachusetts, the overall unauthorized immigrant population decline was due to decreases in unauthorized immigrants from countries other than Mexico.


