Voters in 41 states and the District of Columbia will get to weigh in on policy initiatives on state ballots in the November 2014 election. There are 147 statewide ballot measures facing voters this year, according to the National Conference of State Legislatures (Underhill, 2014). Among the policy issues up for a vote are measures about marijuana legalization, gun rights and restrictions, abortion and raising the minimum wage.
Pew Research Center surveys of American adults show the opinions of Hispanic registered voters nationwide compared with voters of other racial and ethnic backgrounds.12
Marijuana Legalization

On November 4, proposals to legalize marijuana for recreational use will be on the ballots in Oregon, Alaska and the District of Columbia and a proposal to legalize marijuana for medicinal purposes will be on the ballot in Florida (and Guam).
Hispanic registered voters are split over whether or not they think marijuana should be legalized—49% say it should be made legal while 48% disagree, according to a Pew Research Center survey conducted earlier this year.13 By contrast, black registered voters (63%) are more likely than Hispanic registered voters to say marijuana use should be made legal. Among all Hispanics, the U.S. born are about twice as supportive of marijuana legalization as those born outside the U.S. (57% vs. 27%).
Pew Research Center surveys have also explored other aspects of marijuana use and views. For example, when asked a more detailed question about whether the use of marijuana should be legal for personal use, only for medicinal use or not be legal at all, support for some type of legalization rises, according to a February 2014 Pew Research survey. About eight-in-ten Hispanic registered voters (81%) say it should be legal in some form, with 47% supporting medicinal legalization only and 34% supporting legalization for personal use as well. Similar shares of white (81%) and black (84%) registered voters support legalization with 43% of whites and 41% of blacks favoring legalization for personal use, while 38% of whites and 43% of blacks favor legalization of marijuana only for medicinal use.
None of the ballot initiatives would allow for legal use of marijuana in public places.14 This is in line with public opinion on this question. Some 63% of all registered voters, and 61% of Hispanic registered voters, say that if marijuana were made legal it would bother them if people used it in public.
In the Pew Research survey, Hispanics were less likely than other racial or ethnic groups to report having used marijuana. Some 41% of Hispanic registered voters, and 33% of all Hispanics, say they have tried it at some point in their lives. By contrast, greater shares of all whites (50%) and all blacks (49%) say they have tried marijuana.
If the measures to legalize marijuana do not pass, a majority of Hispanic registered voters would still favor some level of decriminalization—68% say even if marijuana is not legalized, people convicted of possessing small amounts of marijuana should not serve jail time. Among all registered voters, 78% say this.
Regardless of their personal views about whether or not to legalize marijuana for recreational use, Hispanics see the legalization of marijuana nationwide as inevitable—69% of all Hispanics, regardless of their registration status, think that the sale and use of marijuana eventually will be legal nationwide. This is similar to the share of blacks who think this will be the case (67%), but smaller than the share of whites who think so (79%).
Gun Rights and Restrictions
On November 4, two states will vote on ballot measures regarding gun rights or restrictions. In Alabama, voters will be deciding whether to amend their state constitution to explicitly allow citizens of Alabama the right to bear arms. In Washington state, voters face two competing measures: The first would restrict gun control by preventing confiscation of firearms without due process and implementing background checks for firearm sales unless a federal standard is established. The second would strengthen gun control by extending the existing requirement for background checks in purchases made from licensed dealers to all gun purchases, including gun shows, online sales and private sales.
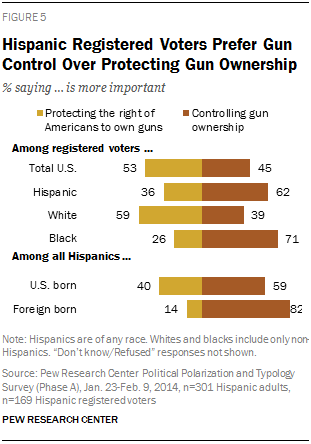
An early 2014 Pew Research Center survey asked U.S. adults what is more important — protecting the right of Americans to own guns or controlling gun ownership (Pew Research Center, 2014d). Hispanic registered voters nationally say they prefer gun control over the rights of owners by a margin of 62%-to-36%, as do black registered voters by a margin of 71%-to-26%, according to the survey. By contrast, white registered voters choose gun owners’ rights over gun control by a margin of 59%-to-39%.
Included in the roughly six-in-ten Hispanic registered voters who say they prefer gun control are 44% who say that most Americans should be able to own guns if certain limits are in place and 18% who say only law enforcement and security personnel should be able to own guns. Also included among the 36% of Hispanic registered voters who think protecting gun rights is a bigger priority are 27% who favor some restrictions on gun ownership and just 9% who favor no such restrictions.
Looking across all Hispanics regardless of their voter registration status or eligibility,15 82% of foreign-born Hispanics think controlling gun ownership is more important than protecting gun ownership rights, compared with 59% of Hispanics born in the U.S. who say the same.
A recent Pew Research Center analysis found that two-in-ten Hispanics say they have a gun, rifle or pistol in their home (Morin, 2014). This is similar to the share of blacks who say this (19%), but whites are twice as likely (41%) to say they have a gun in their home. According to a Pew Research analysis of crime rates in the U.S., 17% of gun homicide victims were Hispanic, proportionate to their 16% share of the U.S. population in 2010. By contrast, blacks make up 55% of gun homicide victims, but just 13% of the U.S. population, while whites make up 25% of victims and 65% of the population (Cohn et. al., 2013).
Abortion
Voters in three states—Colorado, North Dakota and Tennessee—will have the option to vote for ballot measures this year that, if approved, would define conception as the start of life and affect access to abortions and certain birth control methods. The measures in Colorado and North Dakota define life or personhood as beginning at conception, while the Tennessee ballot measure would amend the state constitution to include language empowering the state legislature to “enact, amend or repeal statutes regarding abortion, including, but not limited to, circumstances of pregnancy resulting from rape or incest or when necessary to save the life of the mother.”

Hispanic registered voters are split on the issue of abortion—48% think it should be legal in all or most cases, while 44% say it should be illegal in all or most cases. Included among those who think abortion should be legal are 28% of Hispanic registered voters who say there are some situations where abortion should be restricted and 21% who say there should be no restrictions at all. And included among those who think abortion should be illegal are 29% who say there are some situations where abortion should be allowed and 14% who say abortion should never be allowed.
The views of Hispanic registered voters are similar to those of white and black registered voters—some 49% of blacks and 53% of whites think abortion should be legal, while some 44% of blacks and 41% of whites think abortion should be illegal.
Looking at all Americans, regardless of their voter registration status, whites (54%) are more likely than blacks (47%) and Hispanics (44%) to think abortion should be legal. Among all Hispanics, 51% think abortion should be illegal in all or most cases, including 20% who think abortion should never be allowed.
On the issue of abortion, Hispanics overall have long been more likely to say it should be illegal in all or most cases. Over the last decade, this view has not changed much among all Hispanics, with between 51% and 57% saying abortion should be illegal in all or most cases (Pew Research Center, 2014c).16
This difference between Latino registered voters and all Latinos may reflect different views among U.S.-born and foreign-born Latinos, as most Latino registered voters were born in the U.S. Foreign-born Latinos oppose abortion by a margin of nearly 2-to-1: 60% say it should be illegal in all or most cases, while just 35% say it should be legal. By contrast, 51% of U.S.-born Latinos think abortion should be legal, while 43% think it should be illegal.
Raising the Minimum Wage

Four states—Alaska, Arkansas, Nebraska and South Dakota—will have measures on their ballots this November to raise the minimum wage. If voters pass these measures, the hourly minimum wage would rise incrementally from $7.75 to $9.75 by 2016 in Alaska, from $6.25 to $8.50 by 2017 in Arkansas, from $7.25 to $9.00 by 2016 in Nebraska and from $7.25 to $8.50 in 2015 in South Dakota. The ballot measures in Alaska and South Dakota also include future increases based on inflation. In addition, Illinois has a non-binding advisory question on its ballot to gauge public support for raising the state’s hourly minimum wage from $8.25 to $10 by 2015.
Currently, the federal minimum wage stands at $7.25 and was last raised, in steps, between 2007 and 2009 (DeSilver, 2014).
A Pew Research Center survey in January 2014 asked Americans what they thought about raising the federal minimum wage from its current level of $7.25 an hour to $10.10 an hour. This is a move most (73%) Americans favor (Pew Research Center, 2014a). (None of the ballot measures being considered this year would raise hourly wages to this level, though Alaska’s ballot measure stipulates that the Alaskan minimum wage must be at least $1 higher than the federal minimum wage.) Among Hispanics, 84% favor increasing the federal minimum wage, including 40% who say they strongly favor this move. Meanwhile, 13% of Hispanics say they oppose increasing the federal minimum wage.
The views of Hispanics are similar to those of blacks—86% of blacks say they favor raising the federal minimum wage, as do 67% of whites.
The share of hourly-paid workers at or below minimum wage is similar across racial and ethnic groups—4.4% of Hispanics, 4.3% of whites and 4.9% of blacks, according to a report by the Bureau of Labor Statistics (U.S. Bureau of Labor Statistics, 2014a). However, Hispanics are overrepresented as a share of all minimum wage workers. Hispanics make up 19% of hourly workers that earn minimum wage or less, but they make up 16% of all employed Americans ages 16 and older in 2013 (U.S. Bureau of Labor Statistics, 2014b).


