I. Overview
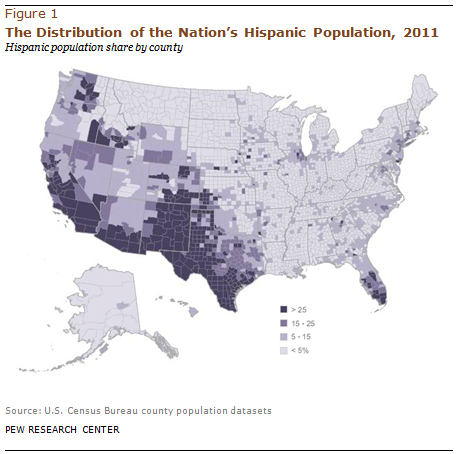
The nation’s Hispanic population, while still anchored in its traditional settlement areas, continues to disperse across the U.S., according to a Pew Research Center analysis of U.S. Census Bureau data.
Today, the 100 largest counties by Hispanic population contain 71% of all Hispanics. Los Angeles County, CA alone contains 4.9 million Hispanics, or 9% of the nation’s Hispanic population. But the share of all Hispanics who live in these same counties has fallen from 75% in 2000 and 78% in 1990 (Fry, 2008), reflecting Hispanic population growth outside of these 100 counties.
Half (52%) of those counties are in three states—California, Texas and Florida. Along with Arizona, New Mexico, New York, New Jersey and Illinois, these eight states contain three-quarters (74%) of the nation’s Latino population. But with the dispersal of the U.S. Latino population across the country, this share too is down from 79% in 2000 and 84% in 1990.
The geographic settlement patterns are to some degree aligned with the diverse countries of origin of the Hispanic population. For example, Mexican origin Hispanics are the dominant group in the Los Angeles-Long Beach metropolitan area, making up 78% of the area’s Hispanics. They are also the dominant group in many metropolitan areas in the border states of Arizona, California, New Mexico and Texas. But along the East Coast the composition of Hispanic origin groups differs. In the New York-New Jersey metropolitan area, Puerto Ricans and Dominicans are the dominant Hispanic origin groups. In Miami-Hialeah, FL, Cubans are the dominant Hispanic group and in the Washington, D.C. metropolitan areas, Salvadorans are the largest Hispanic origin group among that area’s Hispanics. Nationally, Mexicans are the largest Hispanic origin group, making up 64.6% of all Hispanics (Lopez, Gonzalez-Barrera, Cuddington, 2013).

Latinos are the nation’s largest minority group and among its fastest growing populations. According to the U.S. Census Bureau (2013), the Latino population in 2012 was 53 million, making up 17% of the U.S. population.1 Latino population growth between 2000 and 2010 accounted for more than half of the nation’s population growth (Passel, Cohn and Lopez, 2011).
This report examines U.S. Hispanic population rankings in the 50 states and the District of Columbia, the nation’s more than 3,000 counties, and the 60 largest Hispanic metropolitan areas. Accompanying this report are demographic and economic statistical profiles of the Hispanic population in each of the 50 states and the District of Columbia and the 60 largest metropolitan areas by Hispanic population. Also accompanying the report is a database of the Hispanic population in the nation’s counties. Along with the demographic and economic profiles is an interactive map showing key Hispanic population characteristics in all 50 states and the District of Columbia, an interactive map, interactive table and interactive graphics showing Hispanic population characteristics in the 60 largest metropolitan areas by Hispanic population, and interactive maps showing the size, share and growth in the Hispanic population in each of the nation’s counties between 1980 and 2011.
About this Report
This report examines the geographic distribution and demographic characteristics of the U.S. Hispanic population in the 50 states and the District of Columbia, the nation’s more than 3,000 counties, and the 60 largest metropolitan area populations by Hispanic population. The data for this report are derived from the 2011 American Community Survey (1% IPUMS), the 2010 Census (5% IPUMS), and U.S. Census Bureau county population datasets.
Accompanying this report are demographic and economic profiles of the Hispanic population in each of the 50 states and the District of Columbia; a database documenting the Hispanic population in the nation’s counties; and demographic and economic profiles of the Hispanic population in the 60 metropolitan areas with the largest Hispanic populations. Also accompanying this report is an interactive map showing key characteristics in each state and the District of Columbia; interactive maps showing the size, share and growth in the Hispanic population in each of the nation’s counties between 1980 and 2011; an interactive map and table showing the 60 largest metropolitan areas by Hispanic population and a table showing the largest population and shares for the ten largest Hispanic origin groups—Mexicans, Puerto Ricans, Cubans, Salvadorans, Dominicans, Guatemalans, Colombians, Hondurans, Ecuadorians and Peruvians.
This report was written by Anna Brown, Research Assistant, Pew Research Center’s Hispanic Trends Project and Mark Hugo Lopez, Director of Hispanic Research, Pew Research Center. Paul Taylor, Sara Goo, Eileen Patten and Danielle Cuddington provided comments. Eileen Patten and Danielle Cuddington number-checked the report. Bruce Drake was the copy editor.
A Note on Terminology
The terms “Latino” and “Hispanic” are used interchangeably in this report.
“Native born” refers to persons who are U.S. citizens at birth, including those born in the United States, Puerto Rico or other U.S. territories and those born abroad to parents at least one of whom was a U.S. citizen.
“Foreign born” refers to persons born outside of the United States, Puerto Rico or other U.S. territories to parents neither of whom was a U.S. citizen.

