Overview
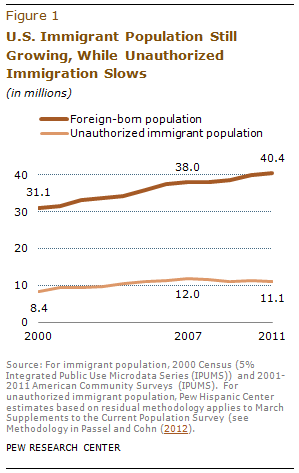
The nation’s total immigrant population reached a record 40.4 million in 2011, according to an analysis of Census Bureau data by the Pew Hispanic Center, a project of the Pew Research Center.
Over the last decade, the number of immigrants in the U.S. has steadily grown. Since 2007 alone, the number of immigrants living in the U.S. increased by 2.4 million.
The number of unauthorized immigrants living in the U.S. also grew during the last decade, rising from 8.4 million in 2000 to 11.1 million in 2011. However, this population peaked at 12 million in 2007, then fell to 11.1 million in 2009. It has remained at that level through 2011, the last year for which an estimate is available (Passel and Cohn, 2012).
The United States is the world’s leader by far as a destination for immigrants. The country with the next largest number is Russia with 12.3 million. The U.S. total of 40.4 million, which includes legal as well as unauthorized immigrants, represents 13% of the total U.S. population in 2011. While the foreign-born population size is a record, immigrants’ share of the total population is below the U.S. peak of just under 15% during a previous immigration wave from 1890 to 1920 that was dominated by arrivals from Europe. The modern wave, which began with the passage of border-opening legislation in 1965, has been dominated by arrivals from Latin America (about 50%) and Asia (27%).
Accompanying this report is a statistical portrait of the nation’s foreign-born population. It is based on the Census Bureau’s 2011 American Community Survey and features detailed characteristics of the U.S. foreign-born population at the national level, as well as state population totals. Topics covered include age, nativity, citizenship, origin, language proficiency, living arrangements, marital status, fertility, schooling, health insurance coverage, earnings, poverty and employment.
The Pew Research Center has also published several reports on the number and characteristics of the nation’s unauthorized immigrant population and on public opinion about immigration policy and views of immigrants. Key findings from this research are shown below.
Number of Unauthorized Immigrants and their Characteristics
The Pew Hispanic Center has published a number of reports on the size and characteristics of the nation’s unauthorized immigrant population. The Center’s latest estimate of the number of U.S. unauthorized immigrants was 11.1 million in 2011, a number that did not significantly change from the previous two years (Passel and Cohn, 2012). Other findings from the Center, based on a number of data sources, include:
- Trends in unauthorized immigration: The most recent Pew Hispanic Center estimate is that 11.1 million unauthorized immigrants lived in the U.S. in 2011. Unauthorized immigration peaked at 12.0 million in 2007, and fell since then mainly because of less immigration from Mexico, the largest source of U.S. immigration (Passel and Cohn, 2012). In 2010, unauthorized immigrants from Mexico made up 58% of all unauthorized immigrants (Passel and Cohn, 2011).
- Unauthorized immigration and children: In 2010, there were 1 million unauthorized immigrants under age 18 in the U.S., as well as 4.5 million U.S.-born children whose parents were unauthorized. These details are included in a report based on 2010 data that also estimates births to unauthorized immigrants; region of origin for unauthorized immigrants; state populations of unauthorized immigrants and unauthorized workers; and overall labor force participation (Passel and Cohn, 2011).
- Characteristics of unauthorized immigrants: In 2010, nearly two-thirds of unauthorized immigrants had lived in the U.S. for at least a decade and nearly half (46%) were parents of minor children. This Census Bureau data-based report also includes data comparing the length of U.S. residence for unauthorized immigrants in 2000, 2005 and 2010. It estimates that 9 million people lived in “mixed-status” families (Taylor et al. , 2011).
- Migration from Mexico: Immigration from Mexico has declined since 2007, largely because of the first decrease in unauthorized immigration in at least two decades. This report includes Mexican data about the characteristics, experience and future intentions of Mexican migrants handed over to Mexican authorities by U.S. law enforcement agencies; and U.S. data on border enforcement as well as characteristics of Mexican-born immigrants in the U.S. (Passel, Cohn and Gonzalez-Barrera, 2012).
- Unauthorized immigrant worker characteristics: Unauthorized immigrants make up 25% of farm workers (not including temporary workers), according to 2008 data in a Pew Hispanic Center report that also includes estimates of unauthorized immigrant shares of other occupations and industries. This report includes details on school enrollment by unauthorized immigrant children and by U.S.-born children of unauthorized immigrants; and estimates of educational attainment, income, poverty rates and health insurance status of unauthorized immigrants (Passel and Cohn, 2009).
Attitudes about Immigrants and Immigration Reform
The Pew Research Center has a number of resources exploring the public’s attitudes towards immigrants and immigration policy. Among some key findings in recent Pew Research Center research:
- Public attitudes about immigration: Immigration policy is not a top priority for the U.S. general public or for Hispanics.1 According to a recent survey of U.S. adults, 39% said that dealing with the issue of illegal immigration should be a top priority for the president and the Congress, placing 17th on a list of policy priorities (Pew Research Center, 2013). For Hispanics, one-third said the issue of immigration was extremely important to them personally, behind issues like the economy and jobs, education and health care (Lopez and Gonzalez-Barrera, 2012).
- Attitudes about immigration policy priorities: Among U.S. adults, 28% say the priority for dealing with illegal immigration should be given to tighter restrictions on illegal immigration while 27% say creating a path to citizenship should be the priority. A plurality (42%) says both tactics should be given equal priority. (Pew Research Center for the People & the Press, 2012). Latinos are more likely than the general public (42% versus 27%) to say the priority should be a path to citizenship for immigrants who are in the U.S. illegally. Just 10% of Latinos say priority should be given to better border security and enforcement. Latinos (46%) and the general public (42%) are about equally likely to say priority should be given to enforcement and legalization (Lopez, Gonzalez-Barrera and Motel, 2011).
- Hispanic Views of Obama’s Deportation Policy: In a 2011 survey of Hispanic adults, by a ratio of more than two-to-one (59% versus 27%), Latinos disapproved of the way the Obama administration was handling deportations of unauthorized immigrants. Nearly 400,000 unauthorized immigrants were deported annually since 2009 (Lopez, Gonzalez-Barrera and Motel, 2011).
- Hispanics’ experiences with deportation: One-in-four (26%) Hispanic adults, and one third (32%) of Hispanic immigrant adults who are not a U.S. citizen or a legal resident, say they personally know someone who has been deported or detained by the federal government for immigration reasons in the past 12 months. Among Hispanic registered voters, 22% say the same. (Lopez and Gonzalez-Barrera, 2012)
- Mexican public opinion: According to a 2012 survey of Mexican adults, more than half (53%) believed that Mexicans who move to the U.S. have a better life there. And among Mexican adults, 38% said they would move to the U.S. if they had the means or opportunity to do so—18% would come with authorization while 19% would come to the U.S. without authorization (Pew Global Attitudes, 2012).


