Latinos have often been characterized as more socially conservative than most Americans. On some issues, such as abortion, that’s true. But on others, such as the acceptance of homosexuality, it is not. When it comes to their own assessments of their political views, Latinos, more so than the general public, say their views are liberal.
The Pew Hispanic survey also reveals that Latinos are more religious than most Americans—they are more likely to say they belong to a religion and to attend religious services regularly.
Political Ideology
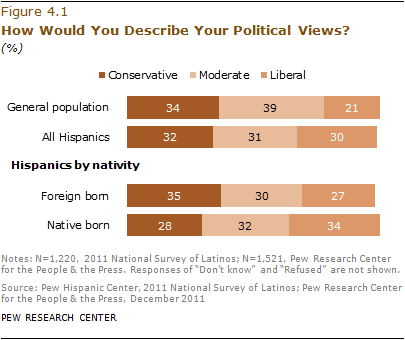
Much has been made about the socially conservative views of Hispanics. This is true on some specific issues (such as abortion), yet results from the survey suggest that Hispanics are no more or less likely than the general public to describe their political views as conservative. Some 32% of Hispanics and 34% of all U.S. adults say their political views are “very conservative” or “conservative.”
However, Latinos are more likely than the general public to describe their views as liberal. Overall, 30% of Latino adults say this, while just 21% of all U.S. adults say the same.5
Foreign-born Hispanics are more likely than native-born Hispanics to describe their political views as conservative—35% versus 28%. Meanwhile, native-born Hispanics are more likely than immigrant Hispanics to describe their political views as “very liberal” or “liberal”—34% versus 27%.
Bigger Government or Smaller Government?

When it comes to the size of government, Hispanics are more likely than the general public to say they would rather have a bigger government providing more services than a smaller government with fewer services. Some 75% of Hispanics say this, while 19% say they would rather have a smaller government with fewer services. By contrast, just 41% of the general U.S. public say they want a bigger government, while nearly half (48%) say they want a smaller government.
Support for a larger government is greatest among immigrant Latinos. More than eight-in-ten (81%) say they would rather have a bigger government with more services than a smaller government with fewer services. The share that wants a bigger government falls to 72% among second-generation Hispanics and 58% among third-generation Hispanics.
Views of Social Issues
Hispanics have more conservative views than all Americans when it comes to abortion, but Hispanics are just as likely as the general public to say homosexuality should be accepted by society. When it comes to interracial and interethnic marriage, Hispanics overwhelmingly say they are comfortable with a child of theirs marrying someone who is of a different heritage.
Abortion

Hispanics hold a more conservative view of abortion than the general public. More than half (51%) of adult Hispanics say abortion should be illegal in most or all cases, a share greater than that (41%) observed among the general public.
Here again, immigrant generation helps explain these differences. Foreign-born Hispanics are more conservative than native-born Hispanics about abortion. Nearly six-in-ten (58%) immigrant Hispanics say abortion should mainly be illegal. By contrast, just 40% of second-generation Hispanics and 43% of third-generation Hispanics say abortion should be mainly illegal. The views of second- and third-generation Hispanics closely match those of the general U.S. public.
When it comes to support for abortion rights, just 35% of immigrant Hispanics say abortion should mainly be legal, while 56% of second-generation and 54% of third-generation Hispanics say abortion should mainly be legal.
Support for abortion rights also vary by age, but not by gender. Younger Latinos are more likely than older Latinos to say abortion should be legal. A majority (53%) of Latinos ages 18 to 29 support abortion rights. By contrast, majorities of Latinos ages 30 to 49 (51%), ages 50 to 64 (58%) and ages 65 and older (63%) say abortion should be illegal in “all cases” or “most cases.” Meanwhile, half (50%) of Hispanic men and half (52%) of Hispanic women say abortion should mainly be illegal.
Acceptance of Homosexuality

When asked whether homosexuality should be accepted or discouraged by society, majorities of Latinos (59%) and of the U.S. general public (58%) say it should be accepted. Meanwhile, 30% of Latinos and 33% of the general public say homosexuality should be discouraged.
Views on homosexuality vary somewhat by immigrant generation. Just over half (53%) of immigrant Hispanics say homosexuality should be accepted. Among second-generation Hispanics, this share rises to 68%. Among third-generation Hispanics, it is 63%.
The survey also reveals that among Hispanics, women more than men say homosexuality should be accepted by society—62% versus 55%. A similar pattern exists among the general public: 64% of women say homosexuality should be accepted by society, compared with 52% of men (Pew Research Center for the People & the Press, 2011a).
And just as with the general public, younger Hispanics are more likely than older Hispanics to say homosexuality should be accepted by society. Nearly seven-in-ten (69%) 18- to 29-year-old Hispanics say this, as do 60% of Hispanics ages 30 to 49 and 54% of Hispanics ages 50 to 64. By contrast, among Hispanics ages 65 and older, 41% say homosexuality should be accepted by society, while 44% say it should not be. Among the general public, majorities of those ages 18 to 29 (69%), ages 30 to 49 (59%) and ages 50 to 64 (55%) say homosexuality should be accepted by society. Among those ages 65 and older, fewer than half (47%) say the same (Pew Research Center for the People & the Press, 2011a).
Interracial, Interethnic and Interreligious Marriage
Interracial and interethnic marriage rates are rising in the U.S. Today, 8% of all marriages and 15% of all new marriages are ones in which the bride and groom are not of the same race or ethnicity. Overall, Hispanics have some of the highest intermarriage rates, with one-in-four (26%) of new Hispanic marriages in 2010 interracial or interethnic (Wang, 2012).

The Pew Hispanic survey asked Latinos about their attitudes about different types of intermarriage and whether they would be comfortable if a child of theirs married someone who was not of the same heritage or background. Overall, Latinos are comfortable with their children marrying someone who is not of the same heritage (87%), someone who is Latino but not of the same heritage (87%), or someone who is not Latino (84%). However, the survey also reveals that when it comes to a child marrying someone of different religious beliefs, a smaller share (63%) of Latinos say they are comfortable with that.
Latinos and Religion
Latinos as a group are religiously observant. Compared with the general public, they are more likely to claim a religious affiliation and to attend religious services more frequently. However, they are about equally as likely to say religion is important in their lives. Overall, religiosity is highest among immigrant Latinos and lowest among those who are third generation.
Religious Affiliation

According to the Pew Hispanic survey, 83% of Hispanics claim a religious affiliation, a share slightly higher than that seen among the general public (80%).
Among Latinos, most are Catholic—more than three-in-five (62%) say this is their religious affiliation. Meanwhile, one-in-five (19%) Latino adults say they are Protestant, and 14% say they are unaffiliated with any religion.
Among Hispanics, twice as many say they are “born again” or evangelical Protestants as say they are mainline Protestants—13% versus 6%. Only small percentages of Hispanics identify with other religions, such as Mormonism, Orthodox Christianity, Judaism or Buddhism.
Compared with the general public, Hispanics are much more likely to be Catholic—62% versus 23%—and less likely to be Protestant—19% versus 50%. The general public is also more likely than Hispanics to be unaffiliated—19% versus 14%.
Religious affiliation among Latinos varies by immigrant generation. Among foreign-born Latinos, nearly seven-in-ten (69%) identify as Catholic. However, the share who identify as Catholic falls to 59% among the second generation, and 40% among the third generation. By contrast, the share of Latinos who identify as Protestant rises through the generations. Some 16% of immigrant Latinos say they are Protestant. Among the third generation, the share is 30%. Foreign-born and native-born Latinos are about as likely to say they are evangelical Protestants—13% and 14%, respectively.

While only about one-in-ten (9%) foreign-born Latinos are religiously unaffiliated, twice as many (20%) native-born Latinos are unaffiliated. Among third-generation Latinos, nearly a quarter (24%) say they are unaffiliated.
Attendance at Religious Services

Two-in-five (43%) Latinos report attending religious services once a week or more, while one-third (33%) attend services monthly or yearly, and one-in-five (22%) say they seldom or never attend religious services.
Hispanics are more likely than the general public to attend religious services weekly or more often—43% versus 36%.
Among Hispanics, Protestants (61%) and evangelical Protestants (70%) are more likely than Catholics (47%) to report attending religious services at least once a week. Not surprisingly, only about one-in-ten (11%) of those who are religiously unaffiliated report attending religious services weekly.
More than half (52%) of foreign-born Latinos say they attend religious services at least weekly, while only about three-in-ten (31%) native-born Latinos attend at this rate. Among the native born, second- and third-generation Latinos attend religious services at similar rates—32% and 30%, respectively.
The Importance of Religion
Hispanics and the general public are equally likely to say religion is very important in their lives.

Overall, more than six-in-ten (61%) Latinos say that religion is very important in their lives. About a quarter (24%) say that religion is somewhat important, and only 13% say religion is not too important or not at all important in their lives. Among the general public, 58% say religion is very important in their lives (Pew Research Center for the People & the Press and Pew Forum on Religion & Public Life, 2010).
Hispanic Protestants are the most likely to say that religion is very important in their lives. Fully 85% say this, as do nine-in-ten (92%) Hispanic evangelical Protestants. By contrast, among Hispanic Catholics, two-thirds (66%) say that religion is very important in their lives.
As one might expect, religiously unaffiliated Hispanics are the most likely to say that religion is not too important or not at all important (50%), though nearly half of the unaffiliated say that religion is somewhat (33%) or very (16%) important in their lives. This suggests the unaffiliated are not non-religious as a group.
A majority of foreign-born Latinos report that religion is very important in their lives (69%). Among the native-born, about half (49%) say that religion is very important, while about three-in-ten (29%) say religion is somewhat important, and about two-in-ten (19%) say it is either not too important or not important at all.
Religion, Politics and Views on Social Issues

As noted earlier, when it comes to political ideology, Latinos are evenly distributed across the conservative-liberal continuum.
Latino Catholics and Latino Protestants are split about evenly among the three categories. However, among religiously unaffiliated Latinos, nearly twice as many say their political views are liberal or very liberal (45%) than say their political views are conservative or very conservative (23%).
Compared with the general public, Latinos are somewhat more liberal, and this contrast is even greater among Latino evangelical Protestants. This group is three times as likely as white evangelical Protestants overall to call themselves liberal or very liberal (25% versus 8%).
When it comes to homosexuality, majorities of Latino Catholics (60%) and religiously unaffiliated Latinos (77%) say that it should be accepted by society. Hispanic Protestants, however, are more divided on the issue. Some 42% say homosexuality should be accepted by society, while 46% say it should be discouraged. Among Hispanic evangelical Protestants, a majority (51%) say homosexuality should be discouraged by society.
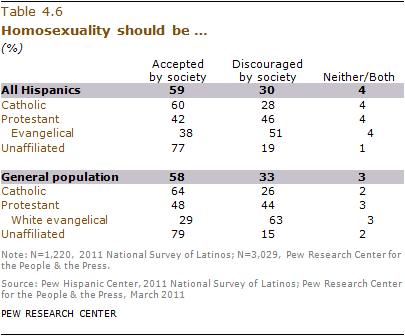
Latinos’ views on homosexuality line up closely with views among the general public as a whole. However, when viewed by religious affiliation, some differences emerge. For example, Latino evangelical Protestants are less likely than white evangelical Protestants to say that homosexuality should be discouraged by society (51% versus 63%).

In the case of attitudes about abortion, while majorities of Hispanic Catholics and Hispanic Protestants believe abortion should be illegal in all or most cases, Hispanic Protestants are somewhat more likely than Hispanic Catholics to hold this view (65% versus 52%). Religiously unaffiliated Hispanics hold the opposite view—more say abortion should be legal (62%) than say it should be illegal (32%).
Compared with the general public, Latino Catholics and Latino Protestants are more likely to say abortion should be illegal (52% and 65%, respectively) than are Catholics and Protestants among the general public (44% and 47%, respectively).


