I. Overview
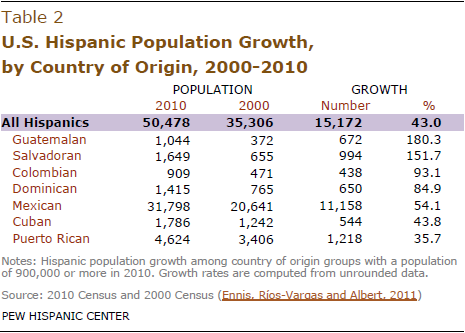
Hispanics of Mexican, Puerto Rican, and Cuban origin or descent remain the nation’s three largest Hispanic country-of-origin groups, according to the 2010 U.S. Census. However, while the relative position of these three groups has remained unchanged since 2000, the next four Hispanic sub-groups grew faster during the decade.
Hispanics of Salvadoran origin, the fourth largest Hispanic country-of-origin group grew by 152% since 2000. The Dominican population grew by 85%, the Guatemalan population by 180% and the Colombian population by 93%. Meanwhile, the Cuban and Puerto Rican populations grow more slowly—44% and 36% respectively (Ennis, Ríos-Vargas and Albert, 2011).1
Country of origin is based on self-described family ancestry or place of birth in response to questions in the Census Bureau’s American Community Survey and on the 2010 Census form. It is not necessarily the same as place of birth, nor is it indicative of immigrant or citizenship status. For example, a U.S. citizen born in Los Angeles of Mexican immigrant parents or grandparents may (or may not) identify his or her country of origin as Mexico. Likewise, some immigrants born in Mexico may identify another country as their origin depending on the place of birth of their ancestors.
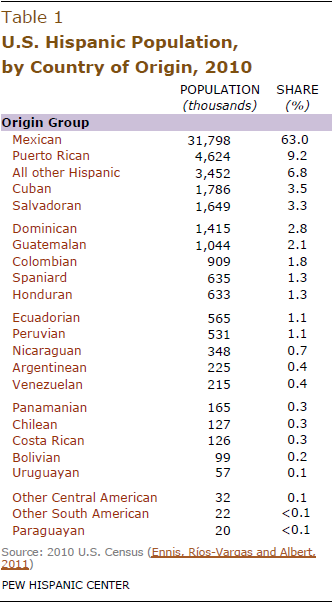
The 2010 Decennial Census counted 50.5 million Hispanics. Among them, there were 31.8 million Mexican-origin Hispanics–the largest Hispanic country-of-origin group. They are followed by Puerto Rican origin Hispanics, who number 4.6 million in the U.S. and make up 9.2% of all Hispanics. Next are Cubans at 1.8 million or 3.5%, Salvadorans at 1.6 million or 3.3% and Dominicans at 1.4 million or 2.8%.
Census 2010 also revealed that there are now more than one million Guatemalan-origin Hispanics in the U.S. Together, Hispanic-origin populations with more than one million people comprise nine-in-ten (90.7%) of the nation’s Hispanics.
This report is accompanied by national level profiles containing geographic, demographic and economic details for the 10 largest Hispanic country-of-origin sub-groups. These profiles are based on the 2009 American Community Survey and include details such as the share foreign born, citizenship rates, household income and levels of educational attainment for each group. The report is also accompanied by two interactive graphics, one ranking the top 10 country-of-origin sub-groups on a number of characteristics, and another showing the country-of-origin sub-groups within the nation’s 30 metropolitan areas with the largest Hispanic populations.
About the Data
The data for this report come from the 2010 Census and the 2009 American Community Survey. The 2010 Census provides information on population counts, including those by country of origin. The 2009 American Community Survey was used to extract detailed demographic and economic information on each of the top 10 country-of-origin groups.
