Recent data from U.S. and Mexican population surveys provide no evidence that an increased number of immigrants have left the United States to return to Mexico since 2006.
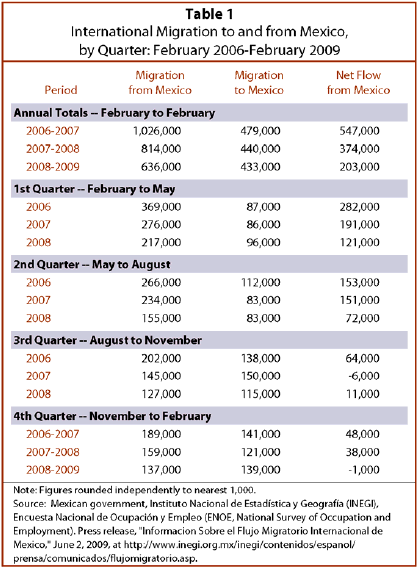
Mexico’s National Survey of Employment and Occupation, which began in 2006, has released data through the first three months of 2009. It offers data on flows into and out of Mexico. Estimates from the survey are released quarterly.1
The survey asks each household in the survey whether any members returned from abroad since the previous quarter. Because migration flow is both seasonal and circular, some of the same people might be counted as outflow in one quarter and inflow in another.
Although there is variation from quarter to quarter, on an annual basis, the number of arrivals home has not increased for any year-to-year period since the Mexican survey began in 2006. From February 2006 to February 2007, an estimated 479,000 Mexicans returned home from other countries, mainly the U.S. For the same period in 2007-2008, 440,000 did. For the 2008-2009 period, 433,000 did.
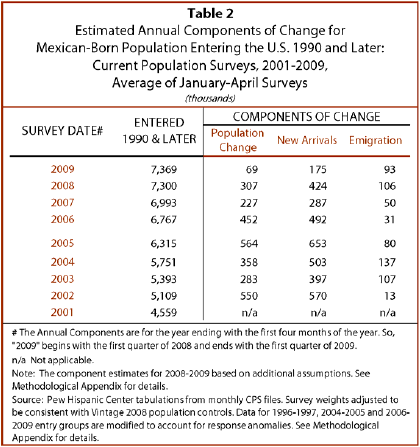
The Current Population Survey, conducted monthly by the U.S. Census Bureau, includes data on the foreign-born population. While not an ideal vehicle for measuring immigration or emigration, the CPS includes data about an immigrant’s year of arrival in the U.S. After adjusting the estimates to ensure that all years were consistently weighted, data were extracted for Mexicans who arrived since 1990 to examine changes in the number moving to and from the U.S.
Emigration is estimated by subtracting new arrivals and deaths during the year from the change in the Mexican-born population for that year.2 These estimates of annual migration flows from the Current Population Survey average slightly less than 100,000 per year for 2001-2008. There is no indication of substantially higher outflows in 2007 or 2008; estimates for these years are close to average.
Another approach to assessing emigration flows is to examine changes over time in the size of arrival-year groups. It is to be expected that the size of each group would decline slowly over time as some immigrants return home and some die (although mortality is relatively low for recently arrived immigrants because they are younger than the overall U.S. population).
Detection of trends is complicated by the random nature of sampling variability in the CPS, but in general, the Pew Hispanic Center analysis finds that there has not been a greater-than-expected decline in the size of arrival-year classes. The one exception is the 2004-2005 entry group, which shows a statistically significant decline between 2008 and 2009.