High levels of employment for men but not for women
There were approximately 7.2 million unauthorized migrants in the civilian labor force in March 2005, accounting for about 4.9% of the U.S. workforce of 148 million workers.
Unauthorized male migrants are more likely to work when compared with males who are either legal immigrants or native-born. A number of factors contribute to this higher rate of participation in the workforce. Unauthorized migrants, for one, are much younger than other groups and older workers are more likely to be retired and disabled. Since fewer unauthorized migrants fall into the older age group within the workforce, more are likely to be working. Another significant factor affecting workforce participation is college attendance. Again, few unauthorized migrants attend college, so they are more likely than other groups to participate in the labor force.
Among unauthorized migrants of working age (18 to 64 years old), 94% of males were in the civilian labor force, compared with 86% of male legal immigrants and 83% 0f native-born males. (See Figure 8.)
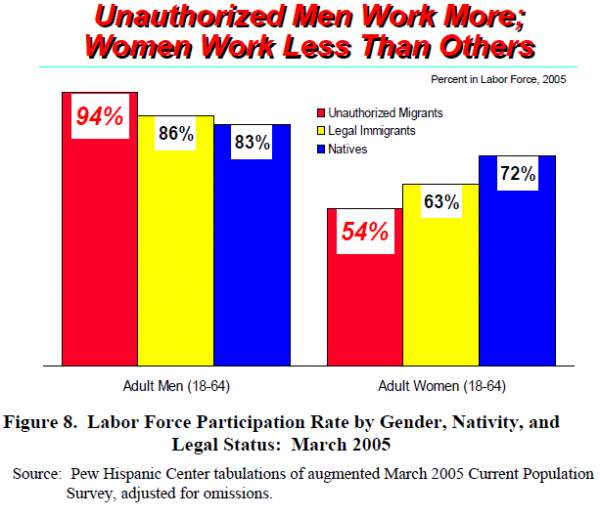
Unauthorized females, on the other hand, were less likely to be in the labor force than legal immigrants or native-born women. About 54% of unauthorized women were in the labor force, compared with 63% for legal immigrants and 72% for native-born women. The lower representation for women is likely due to several factors. The principal reason is the presence of young children in the family. Secondly, married women are less likely to participate in the workforce than unmarried women. Immigrant women are more likely to marry than natives. And, because of higher fertility rates, immigrant women are more likely to have children.
Occupations
Unauthorized workers are employed in a variety of occupations throughout the labor force, although the distribution of the unauthorized workforce across occupations differs from that of native-born workers.
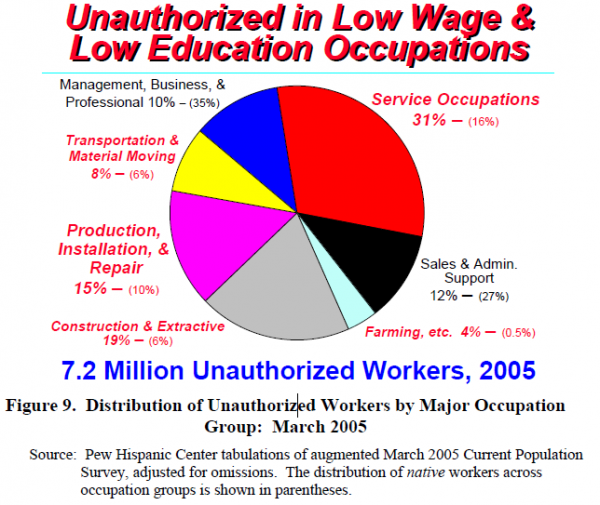
Unauthorized workers are notably underrepresented in white-collar occupations. “Management, business, and professional occupations” and “Sales and administrative support occupations” accounted for more than six of ten native workers (62%) but less than one-quarter of unauthorized workers (23%) in March 2005. On the other hand, unauthorized migrants are much more likely to be in major occupation groups that require little education or do not have licensing requirements. The share of unauthorized employed in agricultural occupations (4%) and construction and extractive occupations (19%) was about three times the share of native workers in these types of jobs. The share in service occupations (31%) was about double that of native workers (16%). (See Figure 9.)
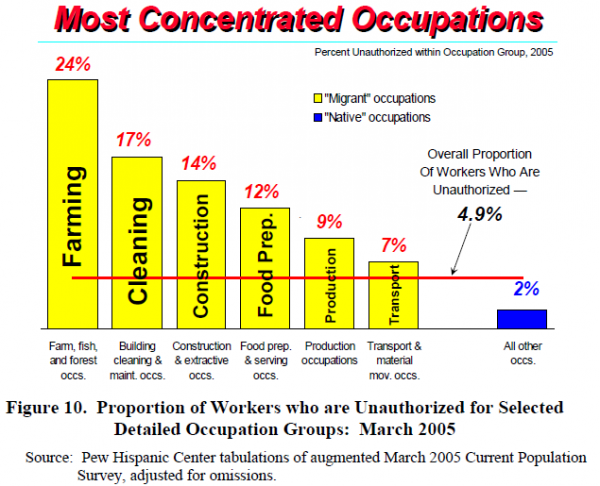
Another way to look at the employment of unauthorized is by measuring how much of an occupational category is filled by unauthorized workers. In a few occupational categories unauthorized migrants make up a large share of all workers employed in those categories. So, although only 4% of unauthorized workers were employed in farming occupations, they make up 24% of all workers employed in those occupations. Elsewhere, the unauthorized were 17% of the workforce in cleaning occupations, 14% in construction and 12% in food preparation industries. (See Figure 10.)
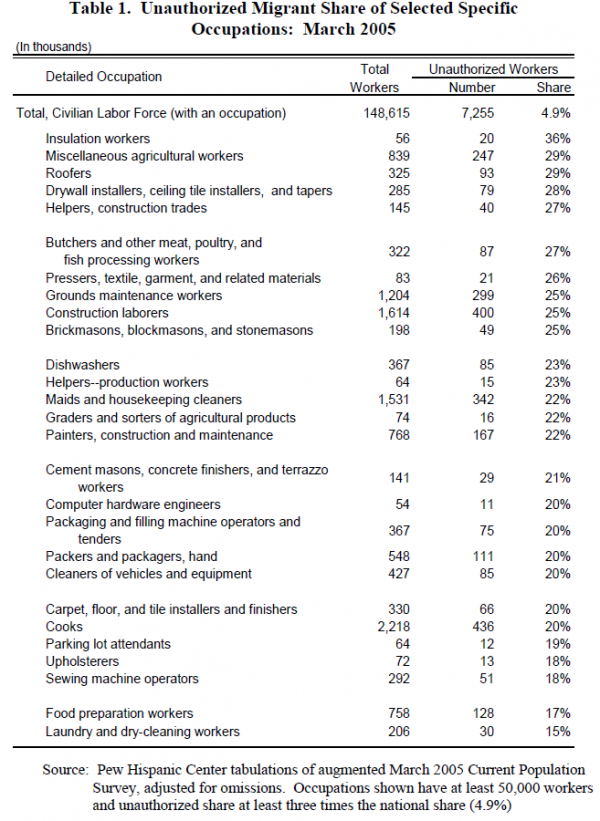
The CPS collects extensive employment data which allows a still more detailed look at the occupations of the unauthorized. There are a variety of detailed occupations in which unauthorized workers make up more than a quarter of all the workers employed. Of course, these specific occupations tend to be found in the occupation groups described above. Moreover, they tend to share the characteristics noted earlier: little or no formal education is required; no licensing is involved; and major preparation can involve on-the-job training. Table 1 shows specific occupations with at least 50,000 workers nationally and in which the representation of unauthorized workers was more than three times their 4.9% share of the civilian workforce. The unauthorized represented: 36% of all insulation workers; 29% of all roofers, drywall installers, and miscellaneous agricultural workers; 27% of all butchers, other food processing workers, and construction helpers.
Industries
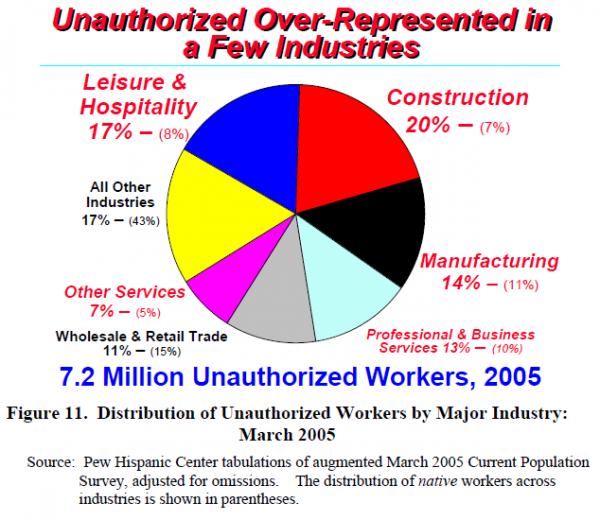
A somewhat different picture emerges from looking at employment data by industry rather than occupation. The concentration of unauthorized workers in major industries is not as marked as the concentration in broad occupation groups. Only in “leisure & hospitality” and in “construction” does the share of unauthorized workers greatly exceed the share of natives. About one in five unauthorized workers was in the construction industry (20%) and one in six is in the leisure & hospitality industry (17%) in March 2005. Only about 7%–8% of native workers were in each of these industries. Neither of these industries tends to require formal credentials from many of their prospective workers. Further, there are many occupations in these industries that require very little formal education. In several industries including services, wholesale and retail trade, manufacturing, and professional and business services, the unauthorized are employed in roughly the same shares of natives. (See Figure 11.)
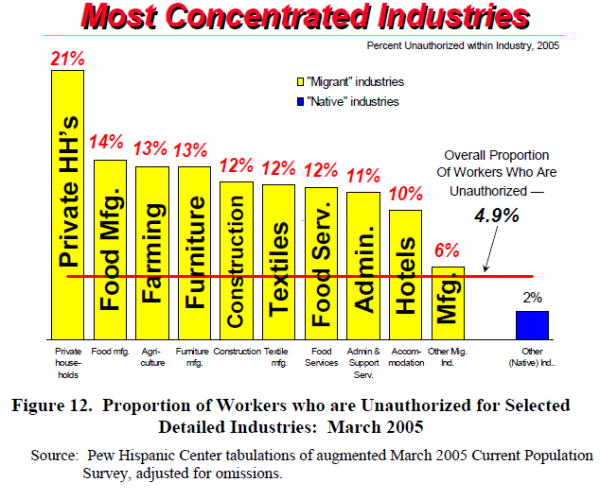
There are fewer detailed industries with high concentrations and significant numbers of unauthorized workers than detailed occupations. The range of credential and educational requirements is generally broader for industries than for occupations. Nonetheless, there are some industries in which unauthorized workers make up a sizeable share of the labor force.
The unauthorized were 21% of the workers in private household industries. They were between 12% and 14% of all the workers in food manufacturing, farming, furniture manufacturing, construction, textiles, and food services. (See Figure 12.)