A college degree opens the doors to higher levels of occupational attainment for Hispanics both in absolute terms and relative to the attainment of whites. Among immigrants, a college degree appears to be strongly related with the possibility of reaching parity in occupational status with whites. Consistent with the findings in the preceding section, results from a sample of college graduates show a high absolute degree of occupational mobility among the college educated. This tendency is most pronounced among recently arrived immigrants and immigrants who do not speak English. However, Latinos with postgraduate levels of education and tenure in U.S. schools are less likely than average to change occupations.
This section presents evidence from the analysis of the 1993 National Survey of College Graduates (NSCG). As the name suggests, the NSCG is a database of college graduates only. The 1993 NSCG has information on whether a worker is in the same occupation or with the same employer as in 1988. Thus, the data can be used to study the mobility of college-educated workers across occupations and employers over a five-year period. With the application of socioeconomic status scores it is also feasible to determine whether a change in occupation was in an upward or downward direction.9
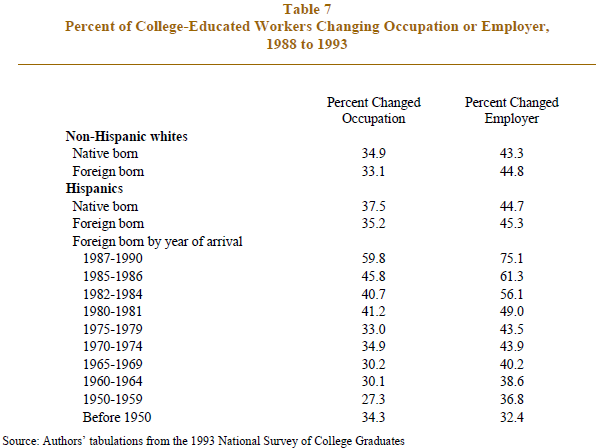
Data on the percentage of Hispanic and white workers that changed occupations or employers between 1988 and 1993 are shown in Table 7. Approximately 45 percent of workers, whether Hispanic, white, immigrant or native born, changed employers between 1988 and 1993.10 The rate at which workers changed occupations—about 35 percent—was slightly lower. The most notable aspect of Table 7 is that the propensity of Hispanic immigrants to change occupations and employers is highest in the first few years spent in the U.S. and then decreases steadily. For example, 60 percent of Hispanic immigrants who arrived in the U.S. between 1987 and 1990 had switched occupations by 1993. In the same group of immigrants 75 percent also switched employers by 1993. But among Hispanic immigrants who arrived in the 1950s these proportions are only 27 percent and 37 percent respectively, or less than half the rate. Thus, the process of assimilation among Latino immigrants involves a very high rate of occupation and employer turnover in the early years presumably as they acquire U.S. labor market experience and find the right match for their skills.
Are there any characteristics that make a worker more or less likely to change occupations? To answer this question, the statistical analysis was first used to estimate the probability, or the likelihood, that the “typical” college-educated worker would switch occupations between 1988 and 1993. The typical, or benchmark, person is defined by the mean values of the characteristics of the workers in the sample.11 For non-Hispanic whites, the benchmark worker is U.S. born with a bachelor’s degree, 16.5 years of labor market experience, and married with one child under six years of age. Among Hispanics, the benchmark worker is U.S. born with ancestry other than Mexican, Cuban or Puerto Rican, has a bachelor’s degree, 14.5 years of labor market experience, and is married with one child under six years of age. Once the probability of switching jobs for the benchmark person has been determined it is possible to alter one characteristic at a time to determine the change in the likelihood of that worker changing occupations.
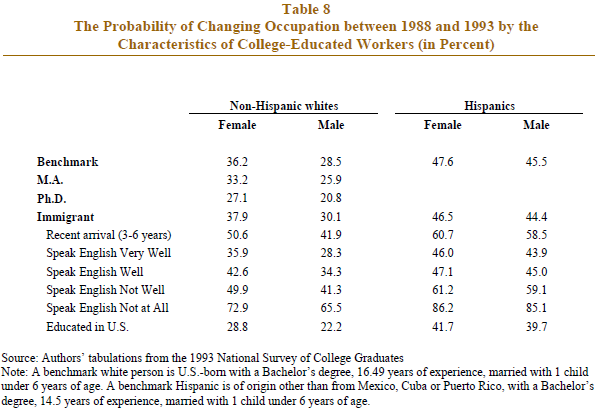
Table 8 shows the occupation-switching probabilities of white and Hispanic workers and the variation in those probabilities across workers with different characteristics. The data in the table show that there was a 28.5 percent probability that the benchmark white male worker changed occupations between 1988 and 1993. The likelihood of occupation change diminishes with education. For example, there was only a 21 percent chance that white males with a Ph.D. switched occupations between 1988 and 1993. That is consistent with the idea that highly educated workers with specific skills are matched better to their job.
Being an immigrant is associated with a slightly elevated likelihood of changing occupations. However, the probability climbs sharply if the immigrant is a new arrival—42 percent for white males who arrived three to six years ago—and does not speak English—65 percent for white males. An immigrant who is educated in the U.S. has a much reduced tendency—22 percent—to move from one occupation to another. Similar results emerge for white female workers, although it is worth noting that female workers in general reveal a higher proclivity for changing occupations.
Almost all male Latinos that do not speak English…are likely to have switched occupations between 1988 and 1993.
The benchmark Hispanic worker reveals a much higher tendency to change occupations in comparison to the benchmark white worker. In particular, the typical college-educated male Latino worker was likely to change occupations between 1988 and 1993 with a 45 percent probability. The probability among immigrant Hispanics is similar although, once again, it is found that the most recently arrived immigrants switch occupations with a much higher probability. Almost all male Latinos that do not speak English—85 percent to be exact— are likely to have switched occupations between 1988 and 1993. Having received an education in the U.S. does diminish the probability of shedding one occupation for another. The results for Hispanic males and females are very similar.
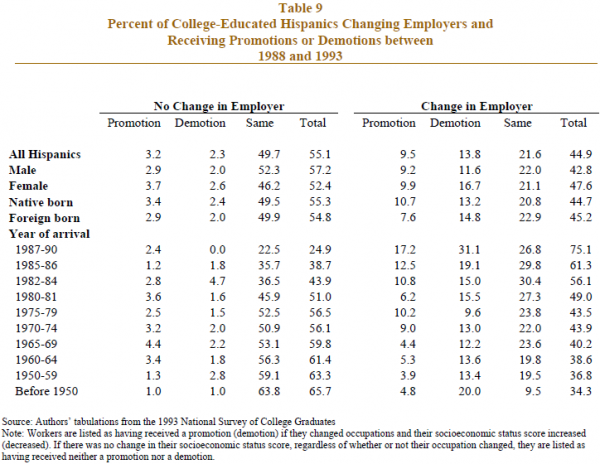
A change in occupation is often accompanied by a change in employer and the association between the two is presented in Table 9. The data in the table show the percentage of college-educated Hispanics that changed, or did not change, employers between 1988 and 1993 and whether there was a change in their occupational status. Workers are listed as having received a promotion (demotion) if they changed occupations and their socioeconomic status score increased (decreased). If there was no change in their socioeconomic status score, regardless of whether or not their occupation changed, they are listed as having received neither a promotion nor a demotion.
For all college-educated Hispanics combined, Table 9 shows that 45 percent changed employers between 1988 and 1993. This move was more likely to be accompanied by a demotion than a promotion. In particular, 13.8 percent of Hispanics switched employers and received a demotion while only 9.5 percent received a promotion with a change in employer. Nearly 50 percent of Hispanics saw no change in employer and socioeconomic status score. In fact, staying with the same employer was unlikely to yield either a promotion—3.2 percent—or demotion—2.3 percent. Almost exactly the same pattern emerges for Hispanic males, females and immigrants. It is somewhat notable that female Hispanics were more likely than men to receive a demotion with a change in employer.
The most distinctive pattern is associated with Hispanic immigrants who arrived between 1987 and 1990. Out of these recent arrivals, only 24.9 percent were with the same employer in 1993 as in 1988. That was less than the 31.1 percent of these immigrants who changed firms and received demotions at the same time. This rate of demotion is double that for all Hispanic combined. At the same time, however, 17.2 percent of recently arrived immigrants earned a promotion when they changed employers, a higher rate than for any other group of Latinos. Thus, Hispanic immigrants with only a brief history in the U.S. are also the most mobile workers moving both up and down the occupational ladder as they assimilate into the labor market.