This section develops two composite measures that may be used to measure differences in occupational distributions and rank occupations by socioeconomic status. The occupational profile of Latino immigrants is found to be the most dissimilar from the profile of white workers. An important reason for this gap is differences in the levels of education. Hispanics and immigrant from Mexico, in particular, are concentrated in occupations that rank among the lowest in socioeconomic status. There is evidence, however, that the socioeconomic status of immigrant workers improves with time spent in the United States.
The occupation of a worker is an important determinant of his or her earnings and employment prospects. Occupations also convey a status upon workers based on the skill requirements and compensation generally associated with that occupation. But the mere distribution of a group of workers across occupations does not yield the information needed to infer their placement in the hierarchy of occupations. Some occupations require high education but pay relatively little, e.g. priests or teachers, while others require less education but pay relatively well, e.g. hazardous occupations in construction and mining. Which set of occupations is more prestigious depends upon the criterion that is applied. A related issue arises with respect to comparisons over time. If Latinos moved from production to construction occupations over time, does that mean an improvement or worsening in their occupational status? And how can we quickly ascertain whether the occupational characteristics of two or more groups of workers are converging over time? Finding answers to these sorts of questions is facilitated by the use of two composite indicators.
The first indicator, termed the Dissimilarity Index, is a measure of the spread across occupational distributions.1 This index ranges in value from 0 to 100 and is a pure measure of differences in the occupational distributions of two groups of workers. The index does not in any sense imply that one distribution is better than the other. It works as follows: Suppose that all Latinos worked in production occupations and all whites worked in sales occupations. The Dissimilarity Index (DI) would then take a value of 100. If Latinos and whites all worked in sales, the DI value would be zero. The index will also equal zero if the same proportions of Latinos and whites are employed in the two occupations. A value of, say, 20, would mean that 20 percent of Latino workers have to switch occupations so that their occupational distribution resembles the occupational distribution of whites.
The occupational profiles of immigrant Hispanic and white workers are the most dissimilar. Figure 5 shows the extent to which the occupational distributions of Hispanics and other workers differ from that of whites. Not surprisingly, 31 percent of male, foreign-born Hispanic workers would have to change occupations to match the occupational profile of male white workers in 2000. For all male Hispanics, blacks, and Asians, the DI index is on the order of 22 to 23 percent. Differences across female workers are less pronounced. About 14 to 18 percent of female Hispanic, black, and Asian workers would have to switch occupations to have occupational profiles that resemble the profile of female white workers. However, the gap among female, foreign-born Hispanic workers and white females—28 percent—is as large as the gap observed for male workers.
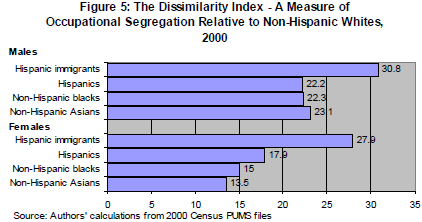
The evidence in Figure 5 shows that the occupational profile of Hispanic workers is just as different from that of white workers as the profiles of black and Asian workers. It is important to note that this does not mean Hispanic workers have the same occupational characteristics as black and Asian workers. For example, in the case of Latinos and whites the difference is driven by the greater concentration of Hispanics in construction and production occupations. But, with respect to Asians and white, the gap is a consequence of the greater presence of Asians in professional and scientific occupations.
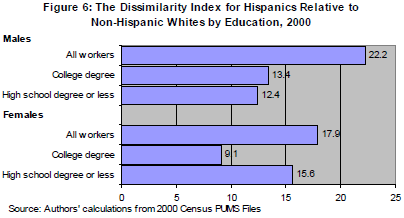
A key factor behind the dissimilarity in occupations is education. When college-educated Hispanic males are compared to their white counterparts, the DI index value shrinks to 13 percent (Figure 6). Similarly, a value of 12 percent emerges when less educated Hispanic and white male workers are compared to each other. But, in the aggregate, it was observed that the gap between Hispanic and white male workers is 22 percent. That is because white males are much more likely to be college-educated than Hispanic male workers. A similar conclusion emerges for Hispanic and white females, but it is worth noting that the gap between college-educated Latino and white females is much narrower than the gap among similar males.
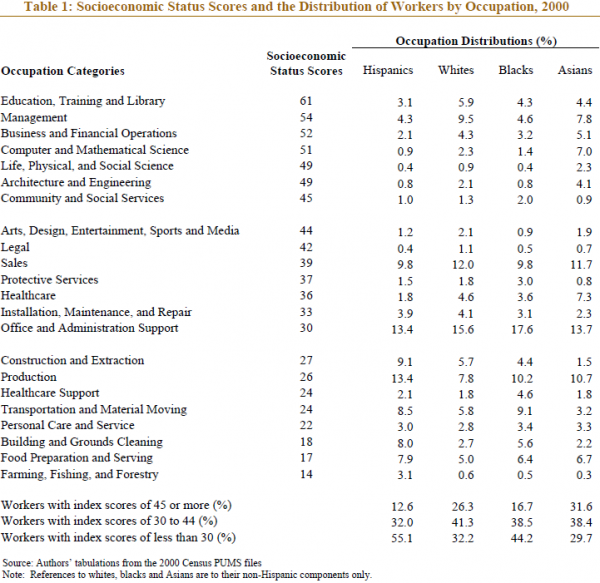
The Dissimilarity Index is a useful tool for summarizing differences in occupational characteristics but it offers no judgment on the status of occupations in which groups of workers are engaged. That is provided by a second indicator that assigns a socioeconomic status score to each occupation. This score is derived from statistical analysis that, based on wages, measures the value each occupation assigns to an additional year of education or experience. The scores are scaled to fall within the range of 0 to 100. Occupations in which education and experience are highly valued will receive scores closer to 100. The average socioeconomic status score across the 475 detailed occupations listed in the Census data in 2000 was 34.8.
Table 1 shows the socioeconomic status score for each of 23 broad occupational categories. The highest score of 61 is attained by education, training and library occupations. Management occupations are close behind with a score of 54. The lowest scoring occupations, all with scores less than 20, are building and grounds cleaning, food preparation and serving, and farming, fishing and forestry.
Hispanics are concentrated in occupations that rank the lowest in socioeconomic status. In Table 1, 23 occupations are divided into three groups as follows: the seven occupations with a score of 45 or higher, the next seven with scores of at least 30 but less than 45, and the final eight with scores below 30. The occupational distribution of Hispanics (also shown in Table 1) reveals that 55 percent of them were engaged in occupations falling in the bottom third of the rankings. The same is true of 44 percent on blacks, but only about 30 percent of whites and Asians work in occupations with the lowest socioeconomic status scores. The roles are reversed at the top as only 13 percent of Hispanics and 17 percent of blacks are employed in the seven highest ranking occupations. Whites and Asians work in these occupations at double these rates—26 percent and 32 percent respectively.
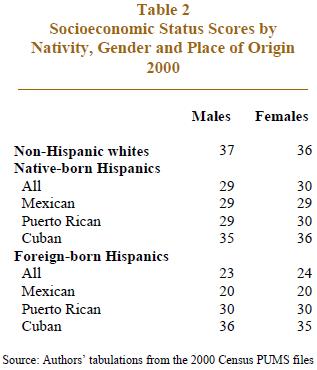
The average socioeconomic status score achieved by Hispanic workers is well below the average for white workers As shown in Table 2 the average socioeconomic status score for white males in 2000 was 37. This is slightly above the overall average of 35. Native-born Hispanic males score only 29 and foreign-born Hispanic males achieve a score of only 23. The lowest score of all belongs to Mexican immigrants whose average is 20 regardless of gender. That average is below the score for all but three of the 23 occupations listed in Table 1. Puerto Ricans and Cubans score above the average for all Hispanics. In fact, Cubans rank along with whites with respect to their socioeconomic status. The scores for male and female workers are virtually identical, differing only by a point here or there.
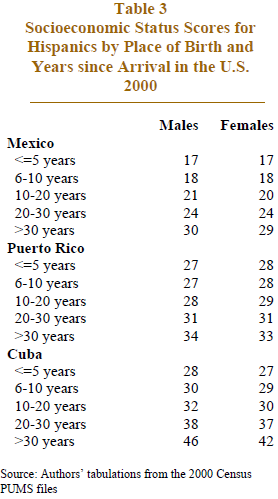
While the socioeconomic status of foreign-born Hispanics is low, it does improve with time spent in the United States. The data in Table 3 show that Mexican immigrants who have been in the U.S. for five years of less attain a score of only 17, but those who arrived in the U.S. over 30 years ago score 30 points, much closer to the overall average of 35 and the average of 37 for whites. Cuban immigrants started high on the scale relative to other Hispanics and those who arrived 20 years ago now have scores of 38 and above, higher than the U.S. average. It should be noted, however, that not all of this increase is necessarily a sign of progress with years spent in the U.S. At least some of this effect could be due to the possibility that immigrants who arrived earlier had a higher level of skills and, therefore, higher occupational attainment regardless of years spent in the U.S. This point is touched upon in greater detail at a later point in the report.