I. Overview
The number of migrants coming to the United States each year, legally and illegally, grew very rapidly starting in the mid-1990s, hit a peak at the end of the decade, and then declined substantially after 2001. By 2004, the annual inflow of foreign-born persons was down 24% from its all-time high in 2000, according to the Pew Hispanic Center analysis of multiple datasets collected by the Census Bureau and other government agencies.
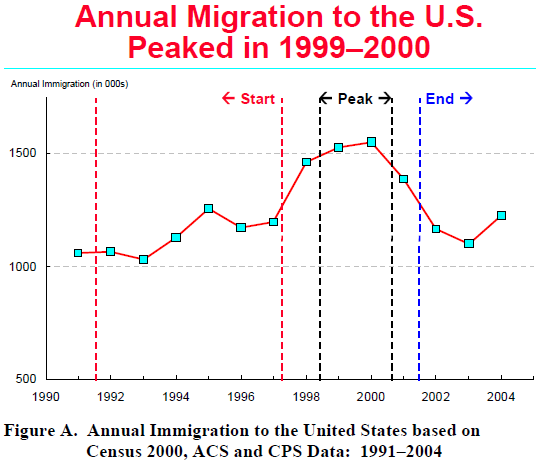
Rather than undergoing a continuous increase in immigrant levels as is commonly perceived, the United States experienced a sharp spike in immigration flows over the past decade that had a distinct beginning, middle and end. From the early 1990s through the middle of the decade, slightly more than 1.1 million migrants came to the United States every year on average. In the peak years of 1999 and 2000, the annual inflow was about 35% higher, topping 1.5 million. By 2002 and 2003, the number coming to the country was back around the 1.1 million mark. This basic pattern of increase, peak and decline is evident for the foreign-born from every region of the world and for both legal and unauthorized migrants.
In 2004, migration bounced back to exceed 1.2 million. Whether or not this move portends further increases is impossible to predict. But even with this recent increase in migration, the most recent data show that immigration flows are at levels comparable with those of the mid-1990s and still significantly below the peak levels of 1999–2000.
Both the run-up to the peak and the drop-off in immigration coincide with a variety of conditions known to influence such flows, most notably the performance of the U.S. economy. Immigration grew sharply during the rapid economic and job expansion of the 1990s and then declined as the economy went into a downturn after 2001. Measures of the change in the Mexican labor force—the largest single source of U.S. immigrants by far—follow trends closely related to the pattern of changes in U.S. immigration. In tracking some trends related to migration, this report does not attempt to assess fully the many different factors that may have caused the rise and fall of immigration flows during this period, but rather illustrates changes in a few key macro-level indicators that mirror the pattern of immigration flows.
The simplest and most commonly available measure of migration to the United States is the size of the foreign-born population; it consistently reaches new highs each year. However, in demographic terms, the total number of foreign-born persons living in the United States at any given point in time does not measure, and can even be misleading concerning, the flow of migrants to the U.S.; i.e., the number of people coming to the country from abroad over a specific period of time. It does provide a measure of the foreign-born stock in the country. Likewise, the foreign-born stock provides a useful measure of the cumulative results of immigration (i.e., additions to the foreign-born population) and of two processes that subtract from the foreign-born stock (deaths among the foreign-born and emigration by the foreign-born).
In this report, a variety of data measuring flows are used to assess changes in migration levels from one year to another over the period from 1992 through 2004. During this period, the steady increases in the overall stock of the foreign-born population could create the erroneous impression that immigration flows themselves have been increasing inexorably at an accelerating pace. In fact, this report demonstrates that entries of migrants suddenly and rapidly accelerated in the second half of the 1990s and then decelerated with almost equal speed after 2001. According to our analyses of the available data, no other spike of these dimensions has occurred since the current era of increased immigration flows began in 1970s. Although the historical data are not strictly comparable, several roughly similar spikes occurred during the trans-Atlantic era of migration; the peaks in immigration then were associated with events such as the Irish potato famine, the end of the Civil War, the dramatic economic swings of the 1890s and 1900s, and World War I.
An accurate assessment of whether immigration flows are rising, falling or holding steady is essential to formulating and evaluating public policy on a variety of issues at the local, state and federal levels. Unfortunately, no single source of data adequately measures such flows. Much of the data supplied by immigration authorities is of little use because the data systems are used to measure administrative processes within the immigration bureaucracy and do not reflect the movement of people into the United States. Further, much of the inflow—a majority in recent years—arrives outside the legal channels. In order to assess recent immigration flows, the Pew Hispanic Center examined data from Census 2000 as well as from two yearly surveys conducted by the Census Bureau—the Current Population Survey and the American Community Survey. All three identify the foreign-born and ask when they came to live in the United States. Additionally, the two surveys ask respondents where they lived a year earlier. Altogether, these data produced at least five and as many as seven different measures of immigrant flows for each of the years examined. Each data source and survey question was analyzed separately to generate comparable measures of the number of arrivals for each calendar year. The individual sources produced different estimates of the level of the inflow in a given year, but all of the sources yielded the same basic pattern of a rise, a peak and then a decline at roughly the same points in time and the same rate of change. These results were then combined into an “average of averages” to produce a single, interpretable measure of immigration. While there is a range of estimates for the inflow in each year, the overall pattern of change over the period is supported by the full weight of the data.
Some of the major findings presented in this report:
Levels of Immigration Flows:
- Immigration flows increased through most of the early and mid-1990s but to a limited extent and very gradually—growing from slightly more than 1 million in 1992 to about 1.2 million in 1997.
- At the turn of the 21st century, immigration levels increased dramatically. This spike took the total inflow to more than 1.5 million in 1999 and 2000—a level about 35% higher than in the middle of the decade. This peak proved to be short-lived, though.
- Since 2000, inflows of immigrants have decreased by about 25% to roughly the levels of the mid-1990s, returning to 1.1 million in 2003.
- The most recent data show a slight uptick in the flow to more than 1.2 million in 2004. With this level of immigration, the foreign-born population will continue to grow, albeit at a slower pace than the rates reached around 2000.
Origins and Types of Immigrants:
- With some variations, the same basic pattern of gradual increase, spike and then decrease holds true for migration from every region of the world.
- Migration from Mexico followed the same overall trends. It peaked in 1999–2000 at a level more than one third above the inflows of the mid-1990s, then declined by about one quarter to 2002–2003 levels that were only slightly higher than those of the mid-1990s. Throughout this period, the Mexican share of total migration held relatively steady at about a third of the overall flow. However, there are indications in new data for 2004–2005 that Mexican migration is again increasing.
- From 1992 to 2004, the unauthorized share of immigration inflows increased and the share that was legal decreased. By the end of the period, more unauthorized migrants than authorized immigrants were entering the United States.
- Declines in legal immigration accounted for the largest part of the drop from the peak flows at the turn of the 21st century. From the peak in 1999–2000 to the trough in 2003, over 60% of the decrease in flow is attributable to lower levels of inflows of legal permanent residents and legal temporary immigrants counted as part of the population.
Destination of New Immigrants:
- The shift of immigrant flows away from states with large foreign-born populations such as California and New York towards new settlement states such as North Carolina and Iowa accelerated during both the peak and the decline that followed.
The Pew Hispanic Center is a nonpartisan research organization supported by The Pew Charitable Trusts. Its mission is to improve understanding of the U.S. Hispanic population and to chronicle Latinos’ growing impact on the entire nation. The Center does not advocate for or take positions on policy issues. It is a project of the Pew Research Center, a nonpartisan “fact tank” in Washington, D.C., that provides information on the issues, attitudes and trends shaping America and the world.


