Hispanics are the second-largest group of workers in the labor force behind whites. In the third quarter of 2004, there were 28 million Latinos of working age (16 or older). The number of working-age Latinos is nearly 3 million greater than the number of blacks and more than double the number of other minority groups.
Latinos are the most likely of all racial or ethnic groups to seek work. In the third quarter of 2004, 69.1% of Hispanics were either at work or actively seeking work. That is about 3 percentage points higher than the rate for whites and blacks. Of the Latinos in the labor market, 18.2 million are employed and the remaining 1.3 million are unemployed. That translates into an unemployment rate of 6.8% in the third quarter of 2004, which is higher than the unemployment rate of 4.3% among whites but lower than the 10.9% rate among blacks. Despite a relatively high unemployment rate, the employment-to-population ratio shows that 64.3% of the Latino working-age population is gainfully employed. That is higher than the proportion for any other racial or ethnic group.
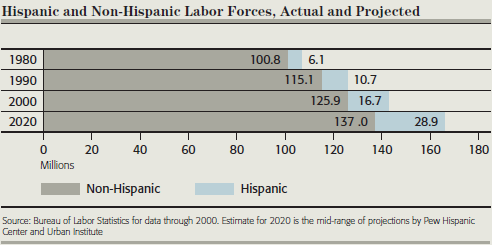
The prominence of Latinos in the labor market is relatively new. As recently as 1980, there were only 6.1 million Hispanics in the labor force. Their rapid growth saw them overtake the black labor force in the late 1990s. This growth was driven by immigration, as more than one half of the Latino labor force is foreign born. The Hispanic labor force is expected to continue growing at a fast pace and to expand by nearly 10 million workers between now and 2020.
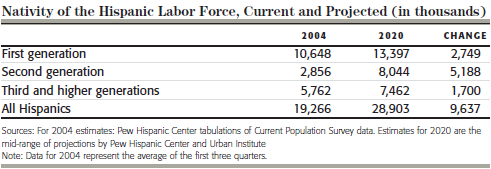
Assuming that current trends persist, future growth of the Hispanic labor force will be driven less by immigration and more by the children of immigrants. Between 2004 and 2020, immigration is expected to add 2.7 million Hispanic workers, but the second generation of Latinos is projected to contribute almost double that number. The overall increase in the Latino work force will constitute about one half of the total increase in the U.S. labor force.
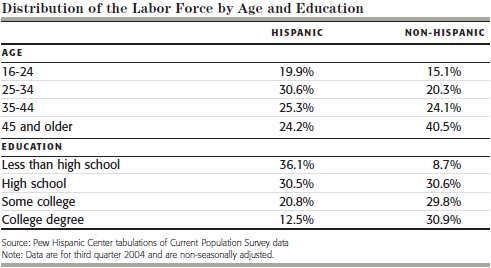
These trends have kept the Hispanic labor force relatively young. One half of the Hispanic labor force is under 35 years old, compared with just over one third of the non-Hispanic labor force. Latino workers also lag in education. Thirty six percent of Hispanic workers lack a high school degree compared with fewer than 9% of non- Hispanic workers. At the other end of the educational spectrum, non-Hispanic workers are nearly three times as likely to have a college degree.
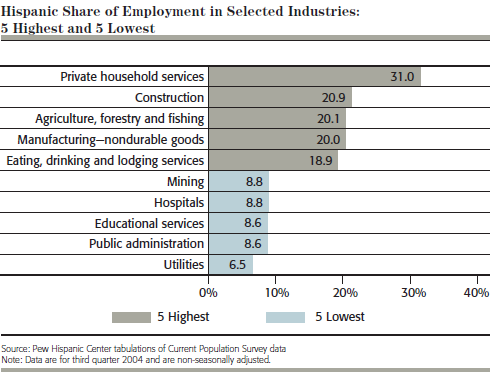
The youth and education level of Hispanic workers translates into a concentration in relatively low-skill jobs. Latinos account for more than 30% of workers in private household services and about 20% of workers in construction, agriculture, forestry and fishing, nondurable manufacturing, and eating, drinking and lodging services.
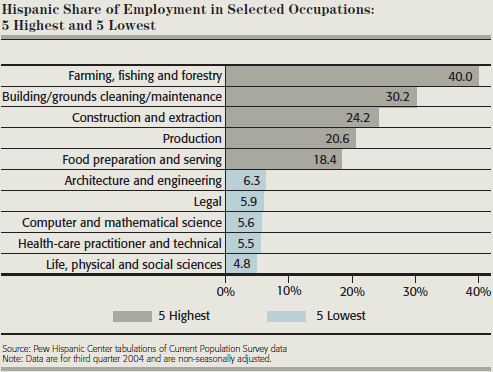
Looking at occupations, Latinos have very low representation in high-skill occupations such as architecture and engineering, legal, computer and mathematical science, health care, and life, physical and social sciences. Hispanic representation in these occupations hovers in the range of 5%. On the other hand, Latinos make up 40% of employment in farming, fishing and forestry.
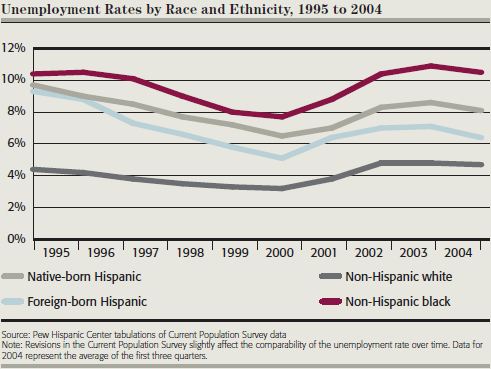
The unemployment rate — a key indicator of labor market outcomes — reveals that Latinos have fared better than blacks but not as well as whites. The record economic expansion of the 1990s was especially beneficial to foreign-born Hispanics, whose unemployment rate fell to 5.1% in 2000 from 9.3% in 1995. Other groups also benefited during this time but not by as much. The 2001 recession rolled back the gains for all workers, and more than 2 million workers in all, including 300,000 Hispanic workers, joined the ranks of the unemployed that year. Signs of a recovery in the job market first appeared in mid-2003. Among Latinos, immigrants again led the way, gaining more than 630,000 jobs in 2003, compared with a gain of less than 75,000 by the native-born. The unemployment rate for foreign-born Hispanics is now at 6.4%, while for native-born Hispanics it remains above 8%.
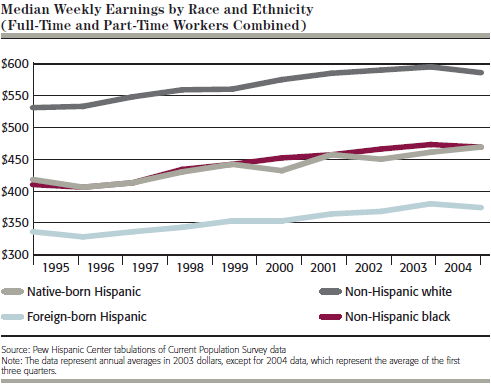
Another important indicator — the median weekly wage — shows that foreign-born Latinos earn the least of all workers in the labor force. Reflecting, among other things, their lower level of education, lack of labormarket experience and immigration status, foreign-born Latinos earn about $200 per week less than whites. The median earnings of native-born Hispanics and blacks are virtually identical and fall in the middle of the wage spectrum, roughly $125 per week less than the earnings of whites. Earning growth has been slow for all groups, especially since the recession, and the earning gaps have not narrowed since 1995.
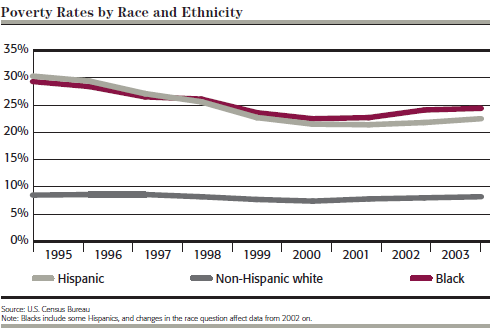
The poverty rate fell steadily between 1995 and 2001, but it increased for all groups following the 2001 recession. Currently, 22.5% of Latinos are living below the poverty line, compared with 24.4% of blacks and only 8.2% of whites.
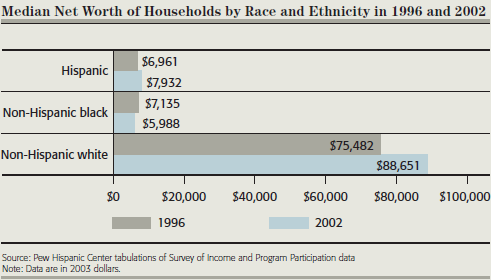
Low wealth is characteristic of minority communities. In 2002, Hispanic households had a slightly higher median level of wealth than black households, but less than 10 cents for every dollar in wealth owned by white households.
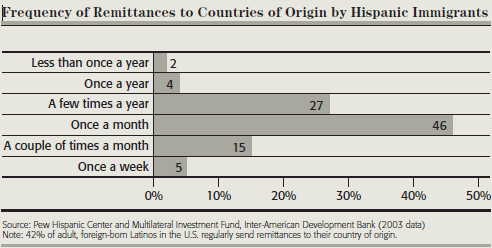
Notwithstanding their low earnings and wealth, foreign-born Latinos remit income to their countries of origin with great frequency. A Pew Hispanic Center and Inter-American Development Bank study shows that over 40% of adult, foreign-born Hispanics — about 6 million people — sent remittances on a regular basis in 2003. Two thirds of those remitted money at least one a month.
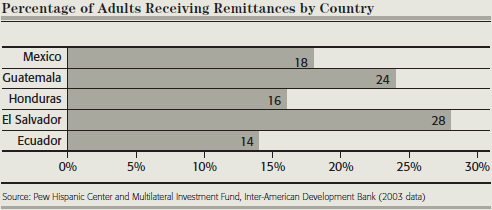
The remittances benefit significant shares of the adult populations in the receiving countries. In the five countries studied, anywhere from 14% of the adult population (in Ecuador) to 28% of the adult population (in El Salvador) received remittances in 2003.